|
Search | Back Issues | Author Index | Title Index | Contents |
![]()
D-Lib Magazine
|
|
|
Naomi Dushay |
![]()
AbstractUser interfaces for digital information discovery often require users to click around and read a lot of text in order to find the text they want to read—a process that is often frustrating and tedious. This is exacerbated because of the limited amount of text that can be displayed on a computer screen. To improve the user experience of computer mediated information discovery, information visualization techniques are applied to the digital library context, while retaining traditional information organization concepts. In this article, the "virtual (book) spine" and the virtual spine viewer are introduced. The virtual spine viewer is an application which allows users to visually explore large information spaces or collections while also allowing users to hone in on individual resources of interest. The virtual spine viewer introduced here is an alpha prototype, presented to promote discussion and further work. 1. IntroductionInformation discovery changed radically with the introduction of computerized library access catalogs, the World Wide Web and its search engines, and online bookstores. Yet few instances of these technologies provide a user experience analogous to walking among well-organized, well-stocked bookshelves—which many people find useful as well as pleasurable. To put it another way, many of us have heard or voiced complaints about the paucity of "online browsing"—but what does this really mean? In traditional information spaces such as libraries, often we can move freely among the books and other resources. When we walk among organized, labeled bookshelves, we get a sense of the information space—we take in clues, perhaps unconsciously, as to the scope of the collection, the currency of resources, the frequency of their use, etc. We also enjoy unexpected discoveries such as finding an interesting resource because library staff deliberately located it near similar resources, or because it was miss-shelved, or because we saw it on a bookshelf on the way to the water fountain. When our experience of information discovery is mediated by a computer, we neither move ourselves nor the monitor. We have only the computer's monitor to view, and the keyboard and/or mouse to manipulate what is displayed there. Computer interfaces often reduce our ability to get a sense of the contents of a library: we don't perceive the scope of the library: its breadth, (the quantity of materials/information), its density (how full the shelves are, how thorough the collection is for individual topics), or the general audience for the materials (e.g., whether the materials are appropriate for middle school students, college professors, etc.). Additionally, many computer interfaces for information discovery require users to scroll through long lists, to click numerous navigational links and to read a lot of text to find the exact text they want to read. Text features of resources are almost always presented alphabetically, and the number of items in these alphabetical lists sometimes can be very long. Alphabetical ordering is certainly an improvement over no ordering, but it generally has no bearing on features with an inherent non-alphabetical ordering (e.g., dates of historical events), nor does it necessarily group similar items together. Alphabetical ordering of resources is analogous to one of the most familiar complaints about dictionaries: sometimes you need to know how to spell a word in order to look up its correct spelling in the dictionary. Some have used technology to replicate the appearance of physical libraries, presenting rooms of bookcases and shelves of book spines in virtual 3D environments [1] [2] [3]. This approach1 presents a problem, as few book spines can be displayed legibly on a monitor screen. This article examines the role of book spines, call numbers, and other traditional organizational and information discovery concepts, and integrates this knowledge with information visualization techniques to show how computers and monitors can meet or exceed similar information discovery methods. The goal is to tap the unique potentials of current information visualization approaches in order to improve information discovery, offer new services, and most important of all, improve user satisfaction. We need to capitalize on what computers do well while bearing in mind their limitations. The intent is to design GUIs to optimize utility and provide a positive experience for the user. 2 Some Background about Information VisualizationCard, Mackinlay and Shneiderman define information visualization as "the use of computer-supported, interactive, visual representations of abstract data to amplify cognition" [4] and describe its purpose as using human perception to amplify cognition [5]. Humans are "hard-wired" to perceive many characteristics easily, including spatial position, color, size, and movement [6]. Since successful information visualization should provide insights to facilitate decision-making, discovery or explanation, effective visualizations will use these easily detected characteristics to illuminate their information. Two-dimensional scatter plots are a familiar type of visualization using horizontal and vertical location of points to indicate two dimensions of particular data. Seeing points arranged in space allows human visual perception to find patterns in the data. Starfield displays expand on scatter plots by supporting rapid interactive filtering (dynamic queries) and zooming [7]. Dynamic queries are visually available without typing: a few clicks of the mouse can assign color to a dimension of the data or can limit the range of values displayed via a range slider. Many dimensions of the data can be represented simultaneously in one visualization by utilizing such features as location, color, shape and size—all easily perceived [8] . Visual query devices allow users to continuously hone in on data of interest, refining their queries until the desired information is apparent. Several research projects have dealt with the "focus + context" problem, which is the problem of focusing on details while at the same time retaining the larger context of the information space [9] [10] [11] [12]. Semantic zoom, or "progressive disclosure" [13] seeks to provide users with appropriate information in appropriate quantities whenever possible [14]. Rao urges a graphical or iconic approach [15] to present a sense of the information space and its patterns to users, requiring little or no reading of text. Rao also urges using the "grain of the wood," that is, illustrating the inherent structure of the data presented, and his is one of many voices urging direct interaction with the data. Lastly, this author agrees with Raskin's notion that there is no such thing as an "intuitive" interface; rather, interfaces can be "very easily learned"—perhaps due to familiar metaphors, simple interaction needs or good user interface (UI) design [16]. This presents a tension between providing a UI with new capabilities or sticking with a UI that is already familiar. 3 A Brief, Recent History of Information OrganizationIn order to provide a better sense of digital information spaces, it may be instructive to examine how libraries and bookstores are organized, because librarians have been pondering information organization for decades. Taylor puts it simply: "we organize because we need to retrieve" [17], while Svenonious states, "The essential and defining objective of a system for organizing information...is to bring essentially like information together and to differentiate what is not exactly alike" [18]. In both libraries and bookstores, materials are usually ordered by subject (with some exceptions for special formats or materials, such as maps, microfiche or rare materials). We are so accustomed to the ways in which libraries and bookstores organize information that when we find resources assembled closely together, we expect them to be similar. Moreover, we can usually determine some sort of subject context for a particular resource by where we find it—the location of the resource conveys information. These organizational methodologies, and the technologies to support them, evolved over many decades—if not centuries—to meet the retrieval needs of users, as well as the needs of those responsible for organizing, maintaining, and growing information spaces. These supporting technologies include books, bookcases, bibliographic metadata, card catalogs (a huge improvement over bound book catalogs), book spines and call numbers, all of which are scaleable as well as useful. 3.1 Call numbers and Co-locationIn order to co-locate resources by subject, libraries use classification systems to assign "call numbers" to these resources. Call numbers indicate a linear order for placement of individual resources on shelves. The two most popular classification systems for library materials in the United States are the Library of Congress Classification (LCC) and the Dewey Decimal Classification (DDC). In both cases, the classification scheme is a hierarchy of topics (i.e., broader topics can contain narrower topics), and sub-arrangements within each topic are possible (e.g., to further organize by author). The call number for a particular resource indicates an assigned classification topic—it locates that particular resource within the topical hierarchy. Because classification is used in libraries to assist in physical ordering of resources, in general only one classification number is assigned to each resource. Additional subject headings from a classification scheme may be added to the bibliographic metadata to promote resource discovery based on other topics relevant to the resource, but the single classification number is based on what the cataloger determines is the primary topic of the book. Moreover, call numbers need to be unique for circulation purposes to distinguish one copy from all other copies of the same resource; therefore, the call number must provide for sub-arrangement by, for example, edition date, copy number, etc. Bookshelves/bookcases are a space efficient way to order books linearly, say by call numbers. However, the shelving can create some inequity in resource discoverability; tall people may have difficulty reading book spines on low shelves, for example. In addition, there can be tension between such linear ordering and the hierarchical classifications of resources. Using call numbers, rather than words, to indicate classifications allows proximity to express similarity. That is, call numbers provide the linear shelving order, and resources having closely related primary topics have closely related call numbers. If the classifications were expressed in words, we either would need a special sorting order for thousands of classification "terms" or we would need to sort alphabetically, thereby losing co-location and its benefits. For example, "horse" and "pony" may be more closely related than "horse" and "hedgehog", but a consistent sorting order for thousands of such terms would be unwieldy. In addition, terms can be ambiguous out of context: does "jaguar" refer to a cat or a car? The classification system disambiguates terms by placing them within a hierarchy, eliminating ambiguity in the assigned classification numbers. It should be noted that classification schemes define hierarchies that are NOT strict tree structures: a classification topic often has "see also" and "see" references to guide users to related topics. These types of relationships between topics are not parent-child and therefore are not allowed in a strict tree. 4 Book SpinesSection 3 described how the location of a resource within a library conveys information about the primary topic for that resource. Another way we get information about physical book resources is from their book spines, which often display some bibliographic metadata. In fact, there is a National Information Standards Organization (NISO) standard entitled Printed Information on Spines for this purpose. The abstract2 to the NISO standard claims, "this standard will help your users identify your product and use it!" by describing "what information to include and how to arrange it for maximum clarity" for "printed bindings, covers, containers...". Clearly there is a belief that certain bibliographic metadata aids user information discovery as well as the organization of resources. Note that book spines are multi-purposed: publishers may use them to visually "brand" their books; bookstores may use them to help sort books by topic and then to order book placement on shelves by author; bookstore customers may use them to identify desired books; libraries might add call numbers to them; library staff use them for organizing books on shelves; and library patrons might use them for identification [19]. Just as a bibliographic metadata record displayed on a computer monitor is a surrogate for the resource, the book spine with its bibliographic metadata is also a surrogate for the resource. Obviously a book spine is closely related to the resource—you can't move a book without moving its spine. Nevertheless, the information on a spine is there to aid information organization and discovery without negatively impacting efficient book storage. 4.1 Virtual (Book) Spines—Better Than Physical Reality? 3Rather than replicate the appearance of physical book spines, or even the specific information presented on them, the goal is to enable information discovery with a computer-mediated approach. Exploring new capabilities only available with non-physical, virtual book spines, hereafter referred to as spines or virtual spines, is a good place to start.
Before useful virtual spines can be created; however, it is necessary to understand the context of the information space (the "grain" or inherent structure of the information [15]) and as much as possible about the intended users of, and the goals and requirements for, the user interface. 5 The National Science Digital Library ContextThe National Science Digital Library (NSDL) is a wide-ranging National Science Foundation (NSF) program to build library collections and services for all aspects of science education [20]. The NSDL has a very broad intended target audience, from "K to gray"— students, instructors, librarians, NSDL federated partners, community interest groups, and the public at all levels. When completed, the NSDL will be a huge information space, used by great numbers of people and containing large quantities of resources. In order to integrate the individual NSDL projects and other relevant information into a coherent, large-scale digital library, the NSDL Core Integration team has created a robust, centralized Metadata Repository (MR). The MR contains bibliographic metadata pertaining to resources in the fields of science, technology, engineering and mathematics from NSDL participating partners, as well as from non-participating open-access web resources. Note that the MR does not store copies of the resources themselves—it stores only the metadata for those resources.
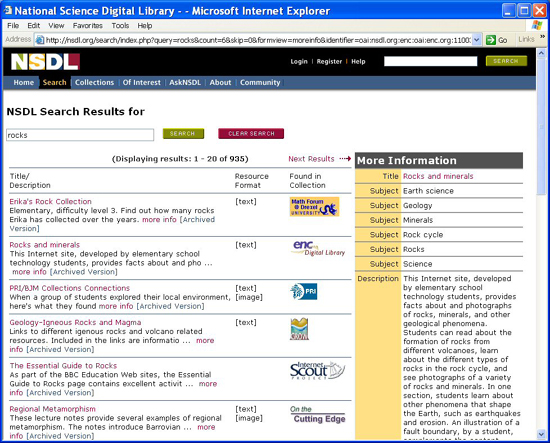
The MR uses a two-tier model comprised of "collections" and their "items." A single item may be large or small, may itself contain parts or smaller units, and can range from simple web sites, to image files, to datasets, to large and sophisticated digital libraries. A collection is defined as an aggregation of (NSDL) items, although collection records may describe collections of digital resources for which there is no available item metadata. Some collections in the NSDL have small icon brand images unique to those collections. These brand images may be displayed to users along with collection or item metadata. For example, brand images are displayed in NSDL search results (see Figure 1). Aside from differences in item granularity and quantity, the quality of resource metadata in the MR varies greatly. As described in earlier papers [21] [22], the NSDL architecture is based on the recognition that, with a library of this complexity, it is impossible to impose detailed requirements for metadata standards that every collection must follow. Instead, the NSDL must accommodate a wide spectrum of metadata quality, anticipating a wide variety of errors or inconsistencies [23]. 5.1 NSDL User InterfacesNSDL end-users are not expected to interact directly with the MR; instead, user interfaces access services such as the NSDL search and discovery service that processes the MR contents. Due to the very broad audience for the NSDL, it was always intended that multiple UIs would be created; different UIs may be targeted for different groups of users or for different user tasks. A tenet of Core Integration UI work has been to leverage free, open-source software, both to keep things simple for end-users and to facilitate service development that can build on NSDL Core Integration efforts.
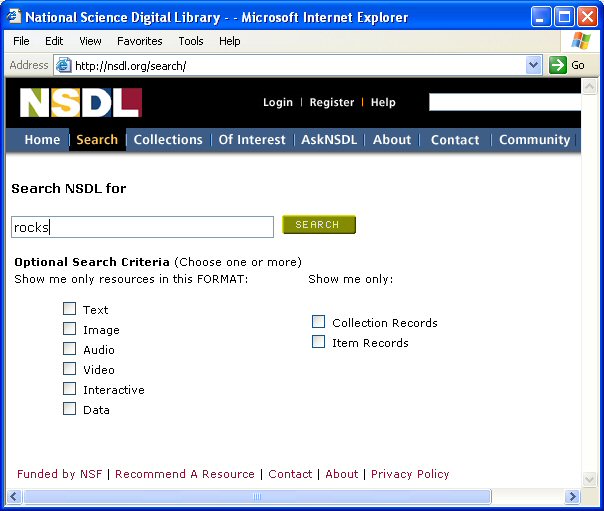
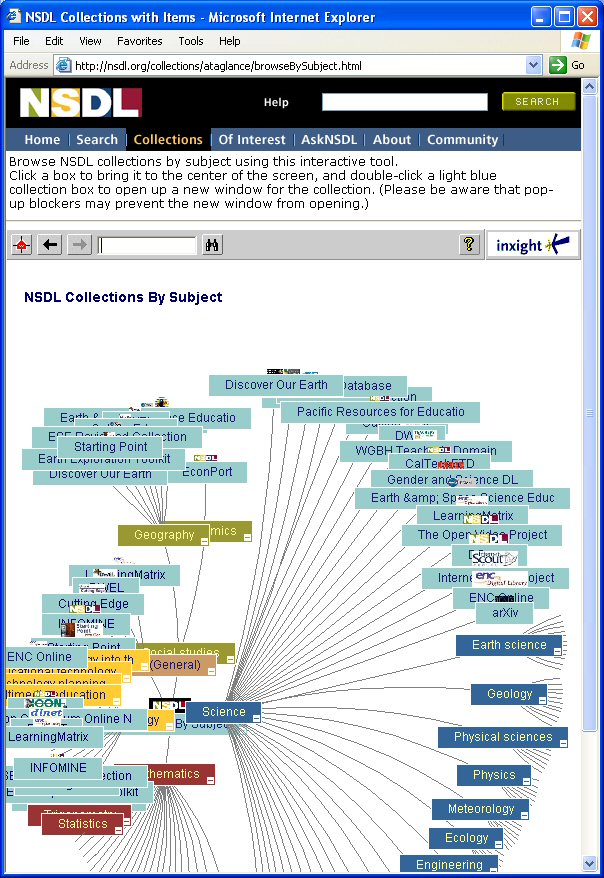
In the context of libraries, two of the most commonly mentioned user tasks are "search" and "browse", but it's too limiting to use only two terms to describe information discovery and retrieval activities. The ideal is to support many different user tasks and user groups; at the present time the main public entrance to the NSDL6 has three user interfaces, which are fundamentally about presenting NSDL MR contents, or information about those contents, to users. Note that one goal these NSDL user interfaces have in common is to convey the sense of a single library with many collections across many subjects. Next, each of these interfaces will be described, and then the prototype virtual spine viewer will be discussed. Figure 2 shows the NSDL Search request form. A few aspects of the search UI should be emphasized. Users can filter their searches in two ways: by resource format and/or by record type (i.e., collection or item). Search requests are sent to the NSDL search service, which returns information about resources deemed appropriate for the query. As seen in Figure 1, search results display resource title, brief description, the format of the resource, and a brand image indicating the collection providing the metadata for the resource to the NSDL. Clicking on the "more info" link in a search result displays the metadata record in the MR corresponding to the search result, while clicking on the title in the search result will connect the user directly with the resource in a new window. The NSDL offers nothing labeled as a "browse" UI, but a UI does provide two ways to explore collections in the NSDL. The alphabetical list of collections7 (not shown here) displays descriptive text and information about the scope of each collection in the MR, while the "NSDL At a Glance"8 (Figure 3) is an interactive visual view of the MR collections organized into a tree structure by subject, implemented using Inxight's Star Tree. Notice that the brand images and the collection titles are chosen for display. The collection description is available as a tool tip, appearing when the mouse hovers over a collection node in the tree; double clicking on a collection node will connect the user directly to the collection's URL in a new window.
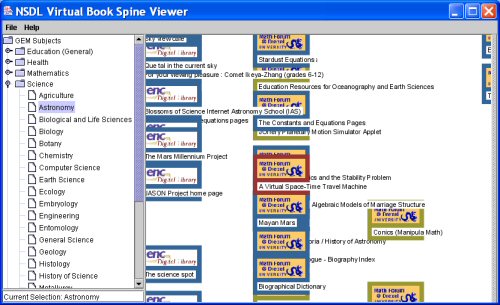
The "At a Glance" hyperbolic tree is one way to present the NSDL information space graphically, relying on arrangement of information and how it moves together to convey meaning to the user in addition to providing text. Users can interact with the Star Tree by changing which part of the tree is centered and therefore displayed in detail, and by performing searches. However, users can't change the information in the tree nor change its structure. The author proposes another user interface, one that allows users to hone in on resources of interest and that presents information akin to what is seen on physical book spines. This interface might be used to get a sense of the information space or parts of it, to get an overview of a large number of resources at once, or even to get detailed information on a few resources of interest. 6 Virtual Spine Viewer - Alpha PrototypeOne of the goals of the virtual spine viewer is to present information via computer monitor analogous to shelves of book spines, capitalizing on the advantages of the computer interface while staying aware of its limitations. Per principles of information visualization mentioned in section 2, users should be able to interact directly with the information resources. The NSDL UI needs to illustrate the inherent structure of the data presented and capitalize on graphic characteristics such as color and location to take advantage of human visual perception. The UI must provide users with appropriate information in appropriate quantities whenever possible, while providing stable and consistent visual areas to help the users navigate easily and remain oriented. The NSDL UI must be very easily learned, with well-designed controls and familiar metaphors. The hope is to apply all these principles to create NSDL user interfaces that meet some under-served information discovery needs. 6.1 Design Issues Specific to the NSDL ContextA number of salient characteristics of the information stored in the NSDL MR have already been mentioned. In many cases, the inherent structure of the information to be displayed suggests a particular approach for the virtual spines and/or the viewer.
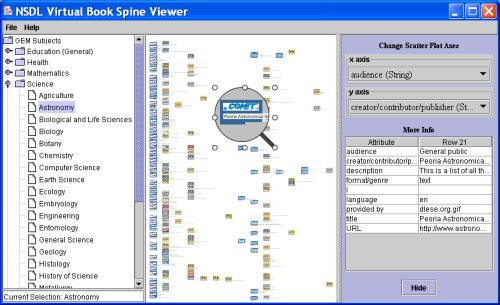
6.2 The NSDL Alpha Prototype Spine Viewer: A Scatter Plot ZUIFigure 4 shows the alpha prototype virtual spine viewer implemented as a java application built on free, open-source APIs. The NSDL borrowed from GRIDL10 [27] for the overall layout of and structure of the application, used Piccolo11 [25] for the ZUI code, and used the Infovis Toolkit12 [28] to implement the scatter plot.
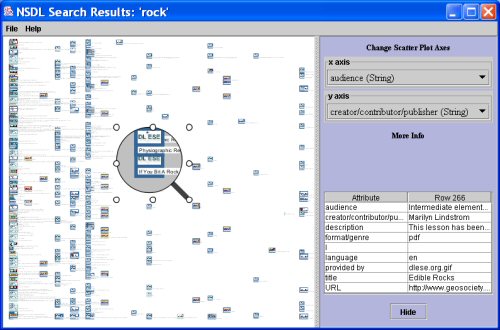
The viewer has three panels. On the left, a two-tiered subject hierarchy13 is presented with the folder metaphor; high-level folders can be closed or opened, and a folder can be selected to display items relevant to that subject. The middle panel is a scatter plot of spines for NSDL resources matching the selected subject folder. The scatter plot has user manipulable axes (controls are in the right panel) and is a zooming user interface. The spines display the brand images for the collection that provided the metadata to the NSDL MR, and spines are color coded by resource format. Collection and format are both emphasized in the NSDL search form (Figure 2) and the search results page (Figure 1). The virtual spines also display the title of the NSDL resource. The implementation of the alpha prototype allows an application developer to create different spine representations easily, as spine appearance should be appropriate to the data being displayed. The viewer allows a number of ways for users to interact with the spines and how they are displayed. A user can choose any subject folder in the left panel to get metadata for resources corresponding to the selected subject. The consistent left panel display of the selected subject folder and its place in the subject hierarchy helps avoid user disorientation or loss of context. The user can assign characteristics to the x-axis or the y-axis, plotting whichever two data characteristics are of interest. For the NSDL prototype, characteristics include audience, additional subjects, creator/contributor/publisher, format, language, metadata provider and title. This allows exploration of the distribution of resources across the information space according to user-selected characteristics. The user can take advantage of the provided magnifying glass to look more closely at an area of the scatter plot and can zoom in or zoom out in the scatter plot (Figure 5) by holding down the mouse button while scrolling left or right, per the Piccolo API. Clicking on a spine in the scatter plot displays the resource metadata in the right side detail panel, analogous to the "More Information" panel in NSDL search results (Figure 1). Double clicking on a spine opens a web connection to the resource's URL, if there is one, and users can smoothly travel from the resource surrogate to the resource itself.
The scatter plot allows users to identify the collections and formats of many resources by their brand images and color. Users also perceive the density of the information space (whether it is a densely or sparsely populated subject in the NSDL), and they may also arrange the spines with axes assignments to highlight other characteristics of interest. Zooming helps users choose information that suits their immediate needs. When the individual virtual spines are tiny, they may appear as little more than specks, but the location of each speck in the scatter plot conveys information, depending on the two characteristics chosen for the axes. When the spines are a little larger, color is discernable in addition to location, so users can see the format distribution of the resources represented in the scatter plot. If the user zooms in a little closer, even if the details of a brand image may not be visible, its basic color(s) and the pattern that distinguishes it from other brands can be discerned. As the user zooms in even more closely, details in the brand images are visible, indicating how many different collections are represented and how they are distributed in the scatter plot. Similarly, while zooming in, a spine's title may first appear as a pattern of rectangles, giving only a sense of the title's length, but zooming in closer will eventually make the text legible. 6.3 A New Presentation of Search ResultsVirtual spines can also be used to present search results graphically and interactively (see Figure 6). Simply remove the folder hierarchy on the left side of the viewer prototype, and display virtual spines corresponding to the search results. The zooming scatter plot has all the same advantages as outlined above: users can organize the presentation of search results by selecting characteristics for the axes, or they can zoom within the scatter plot to get the level of information that interests them—from an overview of their search results, to getting details from particular virtual spines. Also, as above, users can single click on a virtual spine to see the full metadata, and double click to go to the resource itself.
7 Conclusions and Future WorkThe virtual spine approach has great potential in an increasingly digitized, computer-mediated world of information discovery. At the same time, the author is well aware of the urgent need for a user-centered design process for the viewer application. The design of the virtual spines and viewer will benefit greatly from many iterations of user feedback and newly designed prototypes; the author's work to date is presented here to foster discussion and further work. Among other concerns, the author is particularly interested in user feedback on what virtual spines should look like, how many virtual spines can usefully be displayed in the viewer, how virtual spines should appear when zooming to different levels of detail, and if there is an optimal density of virtual spines [14]. It may also be useful to provide alternate visualizations or views of the virtual spine data. One possibility is a table view, allowing users to sort by any combination of columns to organize the data, and perhaps using Fisheye Menus14 for scrolling. Spotfire® has a terrific table implementation, allowing dynamic queries for selection, sorting and so on, but alas, it's not free or open source. User feedback is vital, but even without it, there is a long list of ideas and improvements to implement, such as a) displaying axes values in the scatter plot, b) allowing searches on the text associated with displayed virtual spines, c) better indicating when multiple virtual spines map to the same spot in the scatter plot by using slight displacement, often referred to as jitter, and d) allowing users to select more mappings for display characteristics, such as spine color or shape, in addition to the axes. Some interest has already been expressed for customizable versions of the prototype, and the intention is to create a free, open API to allow maximum configuration possibilities. Three improvements along these lines will be 1) loading the left panel hierarchy in the viewer from a schema-validating XML file, 2) loading data for the scatter plot display from any comma or tab separated text file and 3) allowing an easy way for installation specific spine appearances and mappings. Explorations with the spine viewer prototype have highlighted the benefits of consistent metadata using controlled vocabularies. To this end, the NSDL is working with partners to provide missing metadata for NSDL resources. INFOMINE15 is to provide LCC subject metadata generated automatically from a resource's metadata and its full text, if available for crawling. The Eisenhower National Clearinghouse (ENC)16 will also be enhancing NSDL metadata to support the filtering of NSDL resources by grade level or content pertaining to educational standards. The NSDL also aspires to subject classification visualizations that are useful both to end-users and to collection organizers. The NSDL would like richer subject classification schemes to be more accessible, for example using a subset of LCC rather than the limited subset of GEM subjects the NSDL currently uses in some contexts. In short, the author believes the pairing of information visualization techniques with bibliographic metadata will yield great benefits for information discovery. 8 Acknowledgements and DisclaimersThis work was funded by the National Science Foundation under grant 0227648. The ideas in this paper are those of the author, not of the National Science Foundation. The author would like to thank Anat Nidar-Levi for her help in preparing this paper for publication, the NSDL Cornell team (especially Elly Cramer, Diane Hillmann, Carol Terrizzi and Tim Cornwell), the folks at the Human-Computer Interaction Lab at the University of Maryland, College Park, for their brilliant, inspiring information visualization work (and for their free source code!), and Jean-Daniel Fekete for the Infovis Toolkit. Notes1. One possible merit of such an approach is in teaching traditional library concepts (such as organization by subject, call numbers, the circulation desk, the reference desk) to teenagers and younger children brought up on video games. Whether these traditional library concepts will remain useful or not is another question, beyond the scope of this paper. 2. ANSI/NISO Z39.41 - 1997 (R2002) Printed Information on Spines. Available at <http://www.niso.org/standards/standard_detail.cfm?std_id=526>. 3. With a nod to Ben Shneiderman [24]. 4. Spotfire® DecisionSite, <http://www.spotfire.com/products/decision.asp>. 5. Inxight Software, Inc. StarTree™ <http://www.inxight.com/products/sdks/st/>. 6. National Science Digital Library, <http://nsdl.org>. 7. National Science Digital Library, Alphabetical List of Collections, <http://crs.nsdl.org/collection/>. 8. NSDL Collections interactive browsing tool, <http://nsdl.org/collections/ataglance/browseBySubject.html>. 9. Dublin Core Metadata Initiative DCMI Type Vocabulary, <http://dublincore.org/documents/dcmi-type-vocabulary/>. 10. GRIDL: GRaphical Interface for Digital Libraries, <http://www.cs.umd.edu/hcil/west-legal/gridl/>. 11. Piccolo home page, <http://www.cs.umd.edu/hcil/jazz/>. 12. The InfoVis Toolkit, <http://www.lri.fr/~fekete/InfovisToolkit/>. 13. Currently, the NSDL uses a subset of the Gateway to Educational Materials (GEM) subjects, see <http://search.thegateway.org/> and <http://ns.nsdl.org/schemas/gem_type/>. 14. Fisheye Menus, <http://www.cs.umd.edu/hcil/fisheyemenu/>. 15. INFOMINE: Scholarly Internet Resource Collections, <http://infomine.ucr.edu/>. 16. ENC Online, <http://www.enc.org/>. References1. Christoffel, M. and B. Schmitt. Accessing Libraries as easy as a game. in 2nd International Workshop on Visual Interfaces for Digital Libraries. 2002. Portland, OR. 2. Dumas, C., J. Frederic, and P. Patricia. Libraries: comparisons between the real and the virtual in 3D, 2D zoomable and 2D arborescent. in International Conference on Digital Libraries, Proceedings of the second ACM/IEEE-CS joint conference on Digital libraries. 2002. Portland, OR: ACM Press NYC. 3. Rauber, A. and H.Binha. Visualizing Electronic Document Repositories: Drawing Books and Papers in a Digital Library. in Proceedings of the 5. IFIP 2.6 Working Conference on Visual Database Systems. 2000. Norwell, MA: Kluwer Academic Publishers. 4. Card, S. K., J. D. Mckinlay, and B. Shneiderman. Readings in Information Visualization: Using Vision to Think. p. 6, 1999 Morgan Kaufmann. 5. Ibid. p. 10. 6. Card, et. al.; also Colin Ware. Information Visualization: Perception for Design Morgan. Kaufmann Publishers, San Francisco, CA, 2000. 7. Ahlberg, C. and B. Shneiderman. "Visual Information Seeking: Tight Coupling of Dynamic Query Filters with Starfield Displays." Proceedings of CHI '94, (Boston, MA April 24-28) ACM, New York, 1994, pp 313-317. 8. Hawkins, D.T. "Information Visualization: Don't tell me, show me!" Online, 1999. 88(23). 9. Furnas, George W. "Generalized Fisheye Views" in Human Factors in Computing Systems CHI '86 Conference Proceedings. pp. 16-23, 1986. 10. Sarkar, M. and M. H. Brown. "Graphical Fisheye Views", Communications of the ACM, Vol. 37, No. 12 pp. 73-83, December 1994. 11. Mackinlay, J. D., G. G. Robertson and S. K. Card. The Perspective Wall: Detail and Context Smoothly Integrated, ACM 1991. 12. Robertson, G. G., J. D. Mackinlay and S. K. Card. Cone Trees: Animated 3D Visualizations of Hierarchical Information. ACM 1991. 13. Thomas, J., K. Cook, V. Crow, B. Hetzler, R. May, D. McQuerry, R. McVeety, N. Miller, G. Nakamura, L. Nowell, P. Whitney and P. C. Wong. Human Computer Interaction with Global Information Spaces - Beyond Data Mining. 1998, Pacific Northwest National Laboratory, Richland, WA 99352. 14. Woodruff, A., J. Landay, and M. Stonebraker. "Constant Information Density in Zoomable Interfaces." in AVI - Proceedings of the working conference on Advanced visual interfaces. 1998. L'Aquila, Italy. 15. Rao, R. "See & Go Manifesto - New Visions of Human-Computer Interaction." Interactions, 1999: p. 61-64. 16. Raskin, J. The Humane Interface - New Directions for Designing Interactive Systems. 2000: ACM Press. 17. Taylor, A.G. Organization of Information. Paperback ed. Library and Information Science Text. 1999: Libraries Unlimited. 280. 18. Svenonius, E. The intellectual foundation of information organization. 2000: MIT Press. 255. 19. Tillett, B.B. "Functional Requirements of Bibliographic Records: Final Report." in International Federation of Library Associations and Institutions. 1998. Munich, Germany. 20. Zia, L.L. "Growing a National Learning Environments and Resources Network for Science, Mathematics, Engineering and Technology Education." D-Lib Magazine, 2001. 7(3). Available at <doi:10.1045/march2001-zia> 21. Lagoze, C., et al. Core Services in the Architecture of the National Digital Library for Science Education (NSDL). 2002, Cornell University: Ithaca. 22. Arms, W.Y., et al. "A Spectrum of Interoperability: The Site for Science Prototype for the NSDL." D-Lib Magazine, 2002. 8(1). Available at <doi:10.1045/january2002-arms>. 23. Dushay, N.and D. Hillmann. "Analyzing Metadata for Effective Use and Re-Use." in Dublin Core Conference, Seattle, Washington, 2003. 24. Shneiderman, B. "Visualization Viewpoints: Why Not Make Interfaces Better than 3D Reality?" IEEE Computer Graphics and Application, pp. 12-15, November/December 2003. 25. Bederson, B., J. Grossjean and J. Meyer. Toolkit Design for Interactive Structured Graphics. 2003. 26. Pook, S., E. Lecolinet, G. Vaysseix and E. Barillot. "Context and interaction in zoomable user interfaces." In AVI - Proceedings of the working conference on Advanced visual interfaces. 2000. Palermo, Italy: ACM Press. 27. Shneiderman, B., et al. "Visualizing Digital Library Search Results with Categorical and Hierarchical Axes." In International Conference on Digital Libraries Proceedings of the fifth ACM conference on Digital libraries. 2000. San Antonio, Texas: ACM Press. 28. Fekete, J. "The InfoVis Toolkit." 2003, INRIA Research Report RR-4818, INRIA Futurs, France. http://www.inria.fr/rrrt/rr-4818.html Copyright © 2004 Naomi Dushay |
|
| |
|
|
Top | Contents | |
| | |
|
D-Lib Magazine Access Terms and Conditions doi:10.1045/october2004-dushay
|