|
Search | Back Issues | Author Index | Title Index | Contents |
![]()
D-Lib Magazine
|
|
|
Leslie Carr and Tim Brody |
![]()
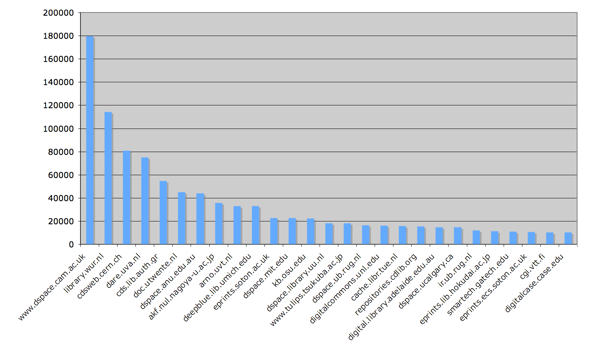
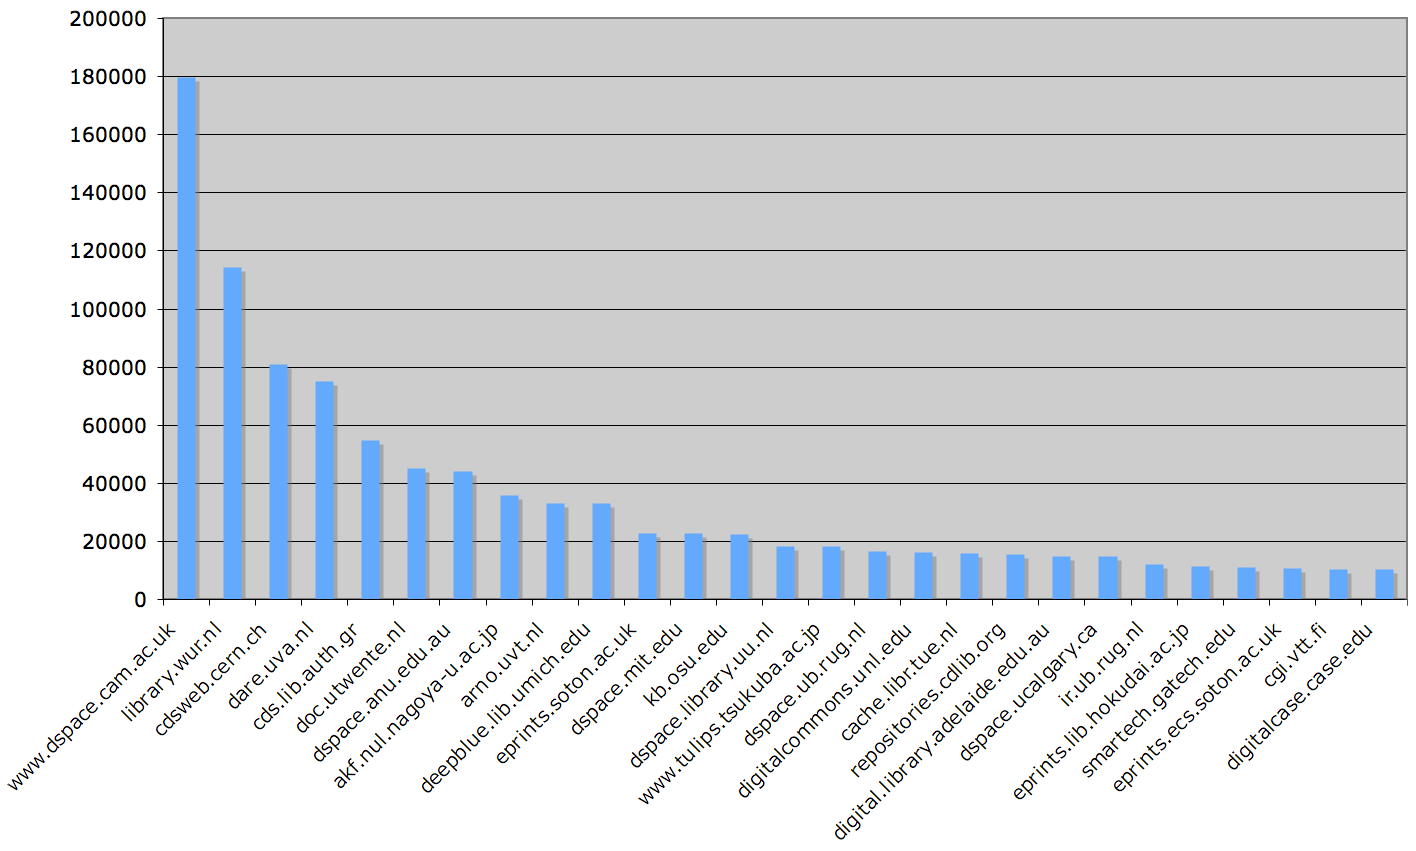
AbstractThe key to a successful repository is sustained deposits, and the key to sustained deposits is community engagement. This article looks at deposit profiles automatically generated from OAI harvesting information and argues that repositories characterised by occasional large-volume deposits are a sign of a failure to embed in institutional processes. The ideal profile for a successful repository is discussed, and a new service that ranks repositories based on these criteria is implemented. The Problem of Evaluating RepositoriesThe definition of an institutional repository as "a set of services that a university offers to the members of its community for the management and dissemination of digital materials created by the institution and its community members" (Lynch 2003) has remained an accurate reference point for technical researchers and IT managers alike in the four years since it was coined. Whether the objective is facilitating open access to research publications, building scholarly collections, creating learning objects, archiving scientific data or preserving content for the long term, the key is to offer these services to the members of the university community. One of the measures of repository success should therefore be the university community's take-up of these services. However, at the time of writing, the most common way to measure the relative success of repositories is to compare the gross number of items that they hold. Registry services such as ROAR (the Registry of Open Access Repositories, roar.eprints.org) and OpenDOAR (Directory of Open Access Repositories, www.opendoar.org) record various attributes of repositories (their location, scope and platform), but the most obvious attribute to measure success is the number of items in a repository.1 Davis and Connolly (2007) identify a problem with this strategy: a repository can exhibit respectable overall growth that is attributable mainly to special-case batch imports. If it is true that community take-up is the foundation of the repository (without staff using the repository's services there would only be an empty repository), then it would be preferable to find a simple way to measure and report that take-up, a way that is achievable automatically and from outside the institution (so that it can be easily and frequently applied to all repositories). Deposits must be fundamental to this measure, as take-up is evidenced by members of the community depositing their materials (be they publications, lecture notes, scholarly items, scientific datasets...), whereas a lack of engagement is evidenced by an absence of deposits. Although a lack of deposits is frequently discussed in the context of an Open Access agenda (e.g., as a failing of the Self-archiving methodology), it is an equal problem for any repository, whether or not the repository is primarily intended to deliver Open Access. Xia and Sun (2007) attempt to develop such an evaluation of repositories, but they base it on depositor identity (which conflates author and editorial processes) and full text percentages (difficult to determine), and they selectively apply these criteria to a small number of repositories. This article attempts to develop some simple metrics of "community take-up" that are available to external observers by analyzing the results of OAI-PMH harvesting. The metrics are demonstrated by embedding them into the ROAR registry of Institutional Repositories. Large RepositoriesFigure 1 charts the number of items in institutional repositories over a threshold of 10,000 records, as listed by ROAR on February 1, 2007. The largest (Cambridge University, UK) contains almost 180,000 digital items. These are all repositories that have achieved an obvious measure of success, featuring in the top 11% (by number of items held) of the institutional repositories catalogued by that registry.
ROAR takes its data from Celestial, an OAI-PMH harvesting proxy that caches the latest version of every metadata record that is harvested from each repository in the world, including information about when each record first appeared.2 It is possible therefore, not only to determine the size of each repository at any instant, but also to build up a picture of its growth over time. In particular, the pattern of daily deposits can be analysed for each institution, and from that information some understanding of faculty-repository engagement can be determined.
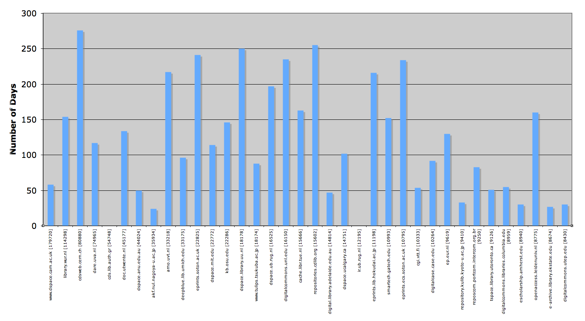
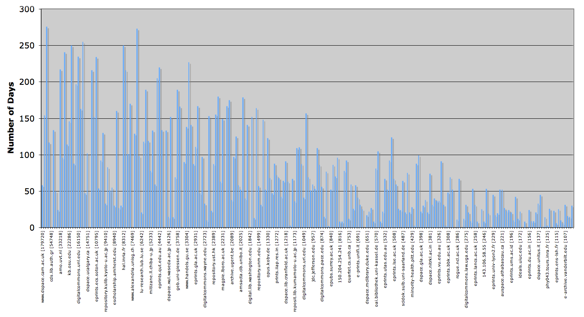
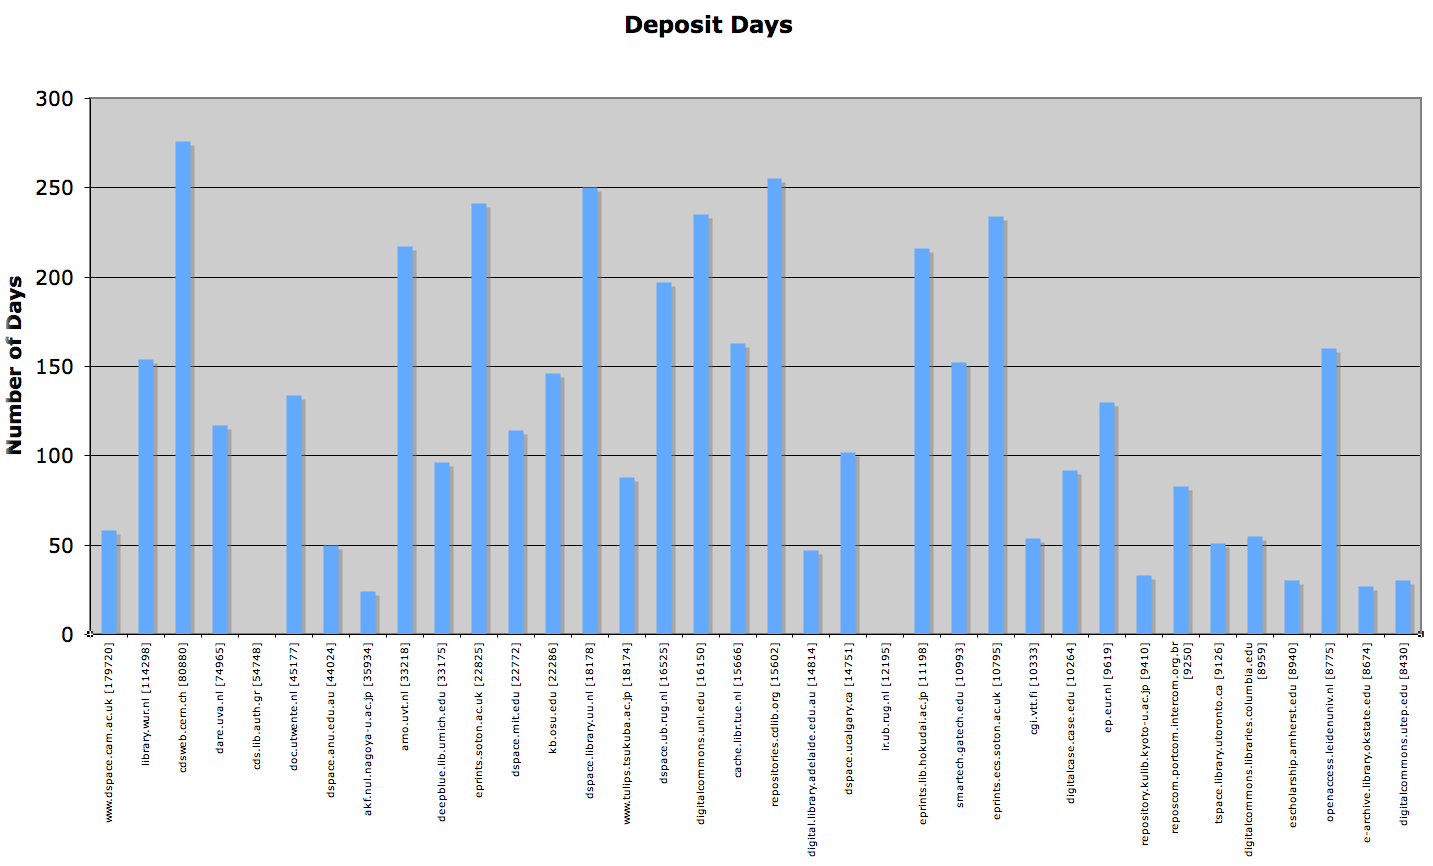
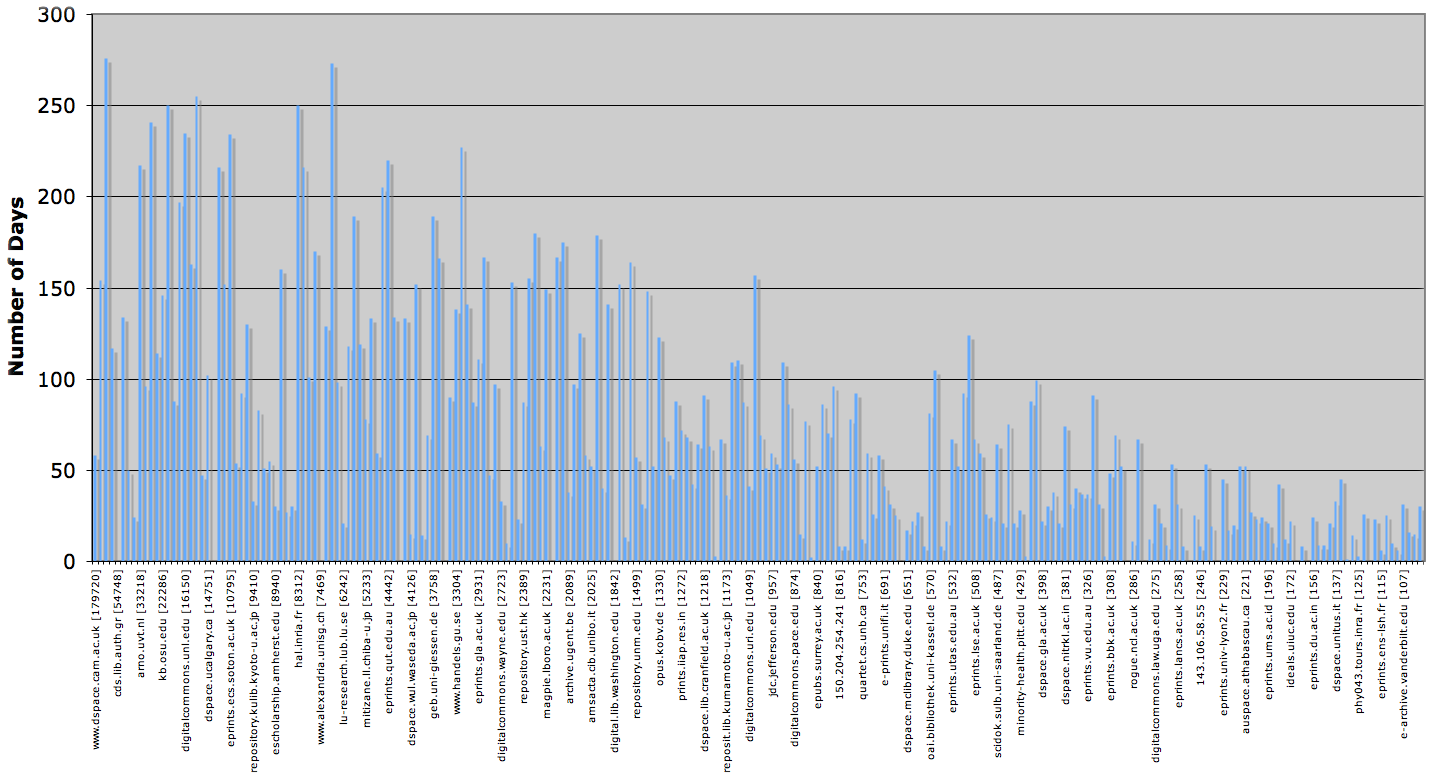
In Figure 2 the ordering of repositories along the horizontal axis is the same as in Figure 1 (largest to the left) while the vertical axis shows the deposit activity in terms of the number of days that deposits are made into the repository between January 1 and December 31, 2006. This graph reveals a big disparity between the use of these repositories for deposit – some of those with the biggest headline numbers are used relatively infrequently for deposit. In fact, half of these large repositories are used for deposit less than half of the year (100 days or fewer). Comparing all 236 institutional repositories rather than just the largest (Figure 3), we can see that many of the smallest repositories are as active as some of the largest although there is a general trend for smaller repositories to be used (i.e., receive deposits) on fewer days. Of course, if they had more deposits on more days then they would be larger!
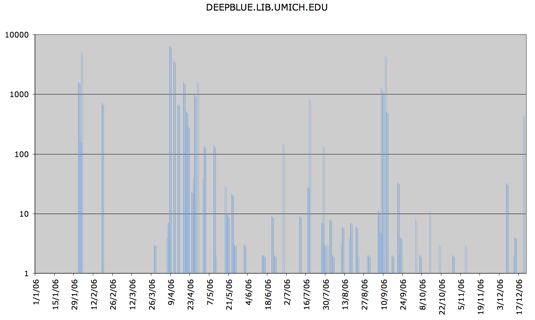
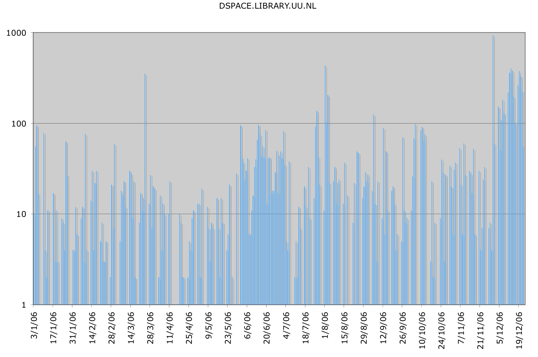
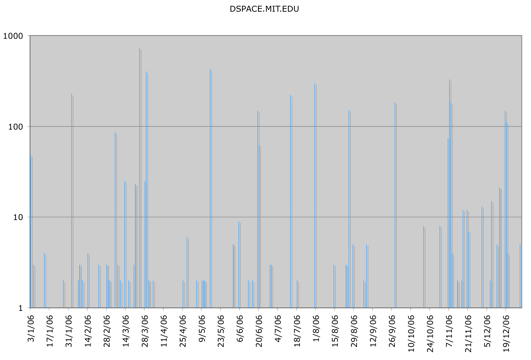
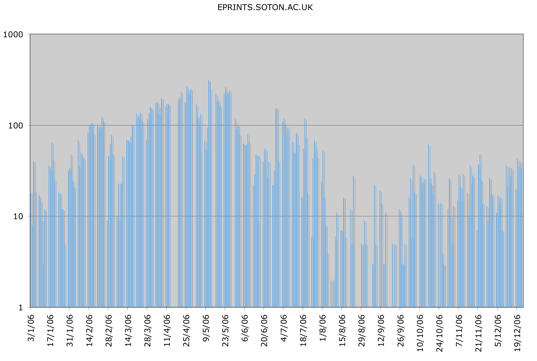
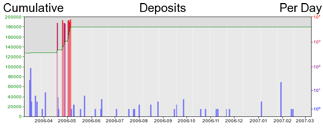
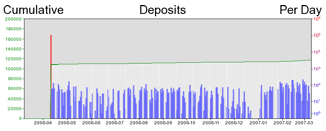
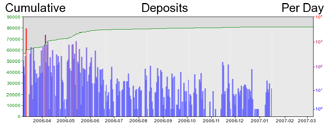
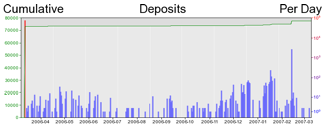
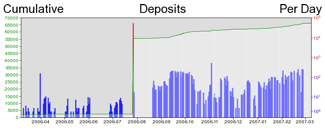
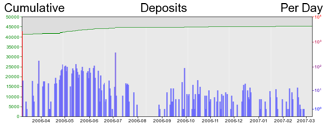
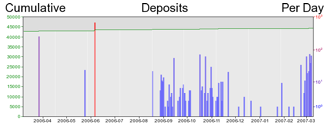
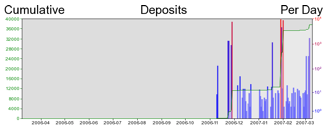
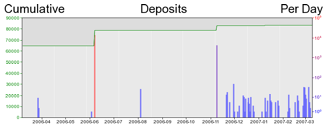
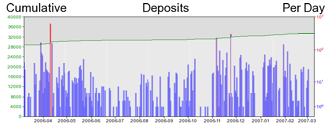
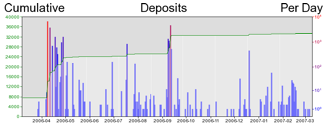
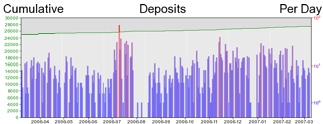
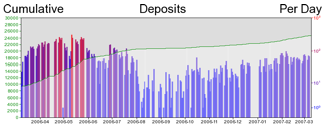
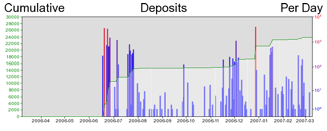
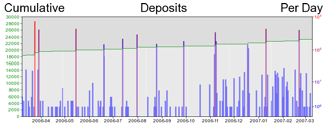
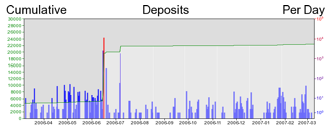
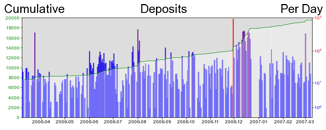
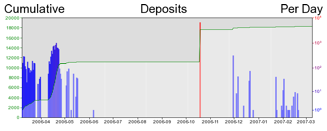
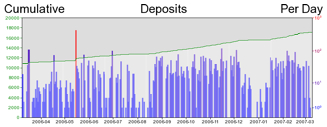
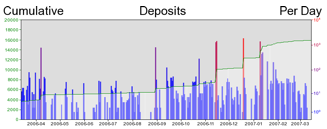
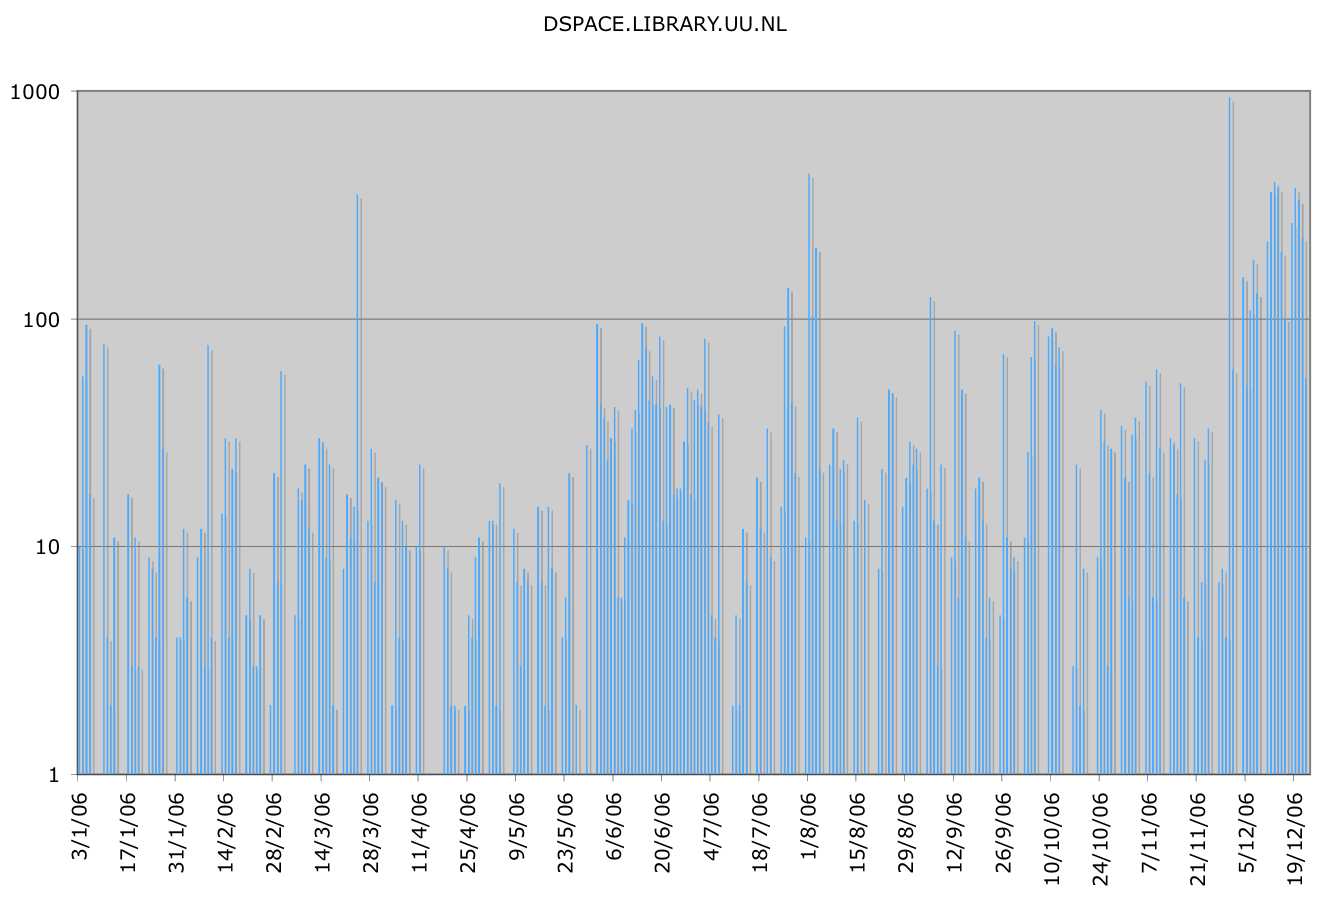
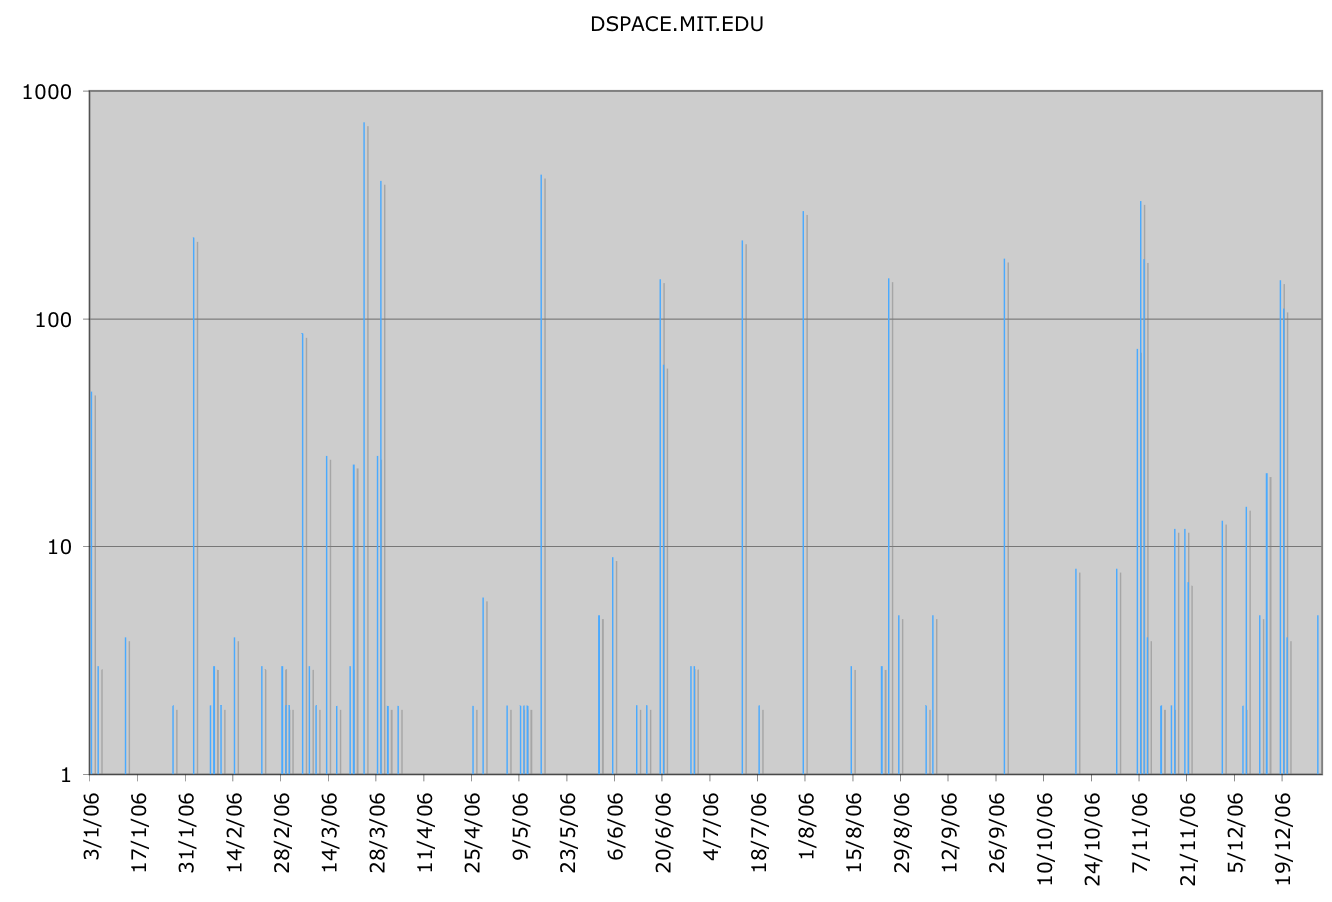
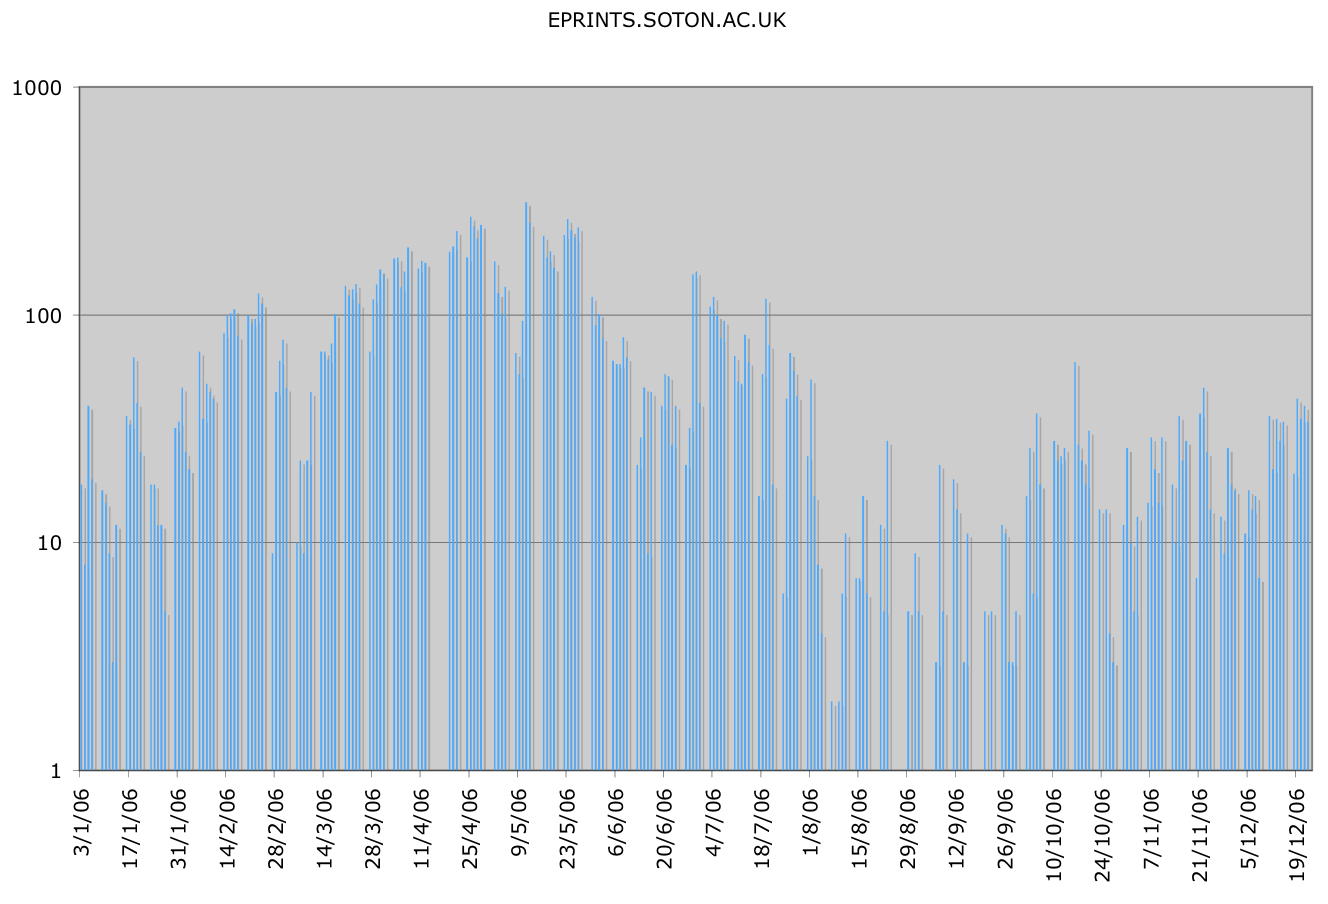
But Figure 4 shows that it is not the case that larger repositories are necessarily receiving deposits more often. Each chart shows a separate repository with the days of the year across the horizontal axis, and the number of deposits received per day on the vertical axis. In these charts the deposit size is plotted in log form on the vertical axis so that the occasional huge deposits don't swamp the more frequent small ones. Two of the repositories have very 'gappy' deposit records, indicating many days of inactivity between (often numerically high) deposits, while the others have more continuous daily deposit activity.
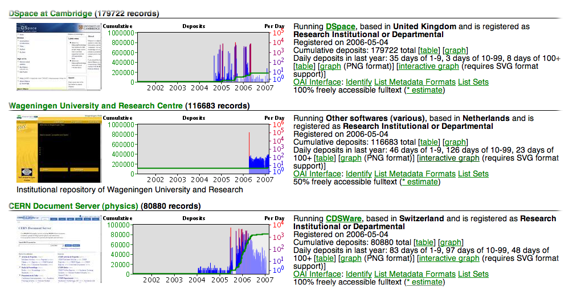
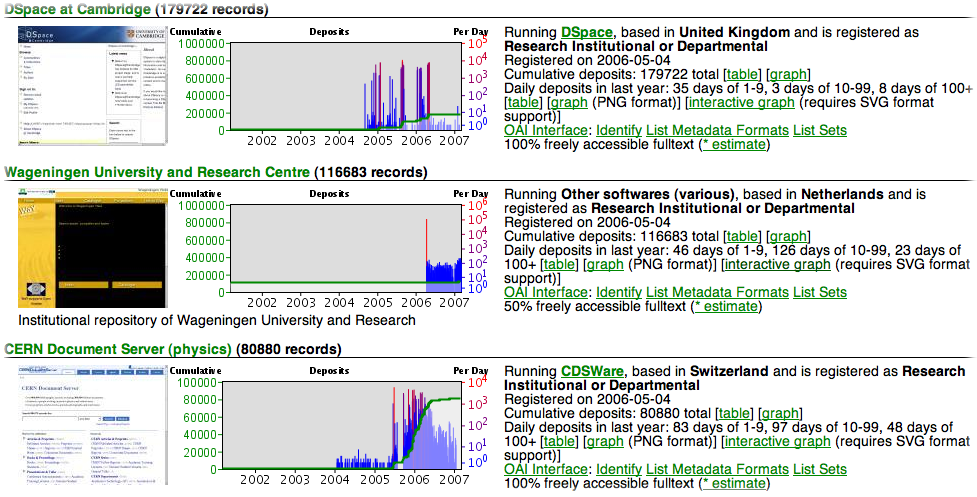
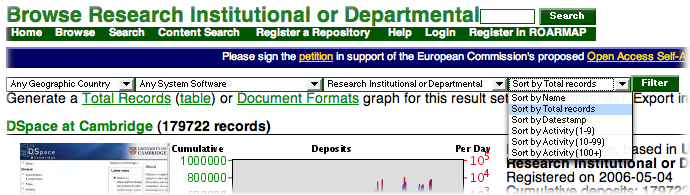
Figure 4-1, 4-2, 4-3, and 4-4: Daily deposit rates in four large repositories Repository Deposit ActivitySome repositories receive infrequent but high-bandwidth deposits (many hundreds or thousands in an individual day), whereas others benefit from more regular but less high-volume inputs. Is there any significant difference in the two cases? Does it matter if a repository receives a daily fillip or a monthly boost if the numbers in both cases average out to provide a healthy year-on-year growth? Is there any significance in the fact that deposits appear only intermittently? Since individuals do not create lectures or papers to fit in with repository timetables, it is likely that deposits would naturally come in an apparently random schedule. If we accept the Lynch 2003 definition of a repository – a set of services offered to the whole community within an institution – then we would expect to see evidence of whole-community engagement within the daily deposits. So unless some behind the scenes scheduling were controlling users' interactions with the repository (e.g., physicists devote Mondays to the repository), deposits would also appear randomly spread across the whole community and the whole subject range of the repository. It is possible to make up some back-of-the-envelope estimates for the expected deposit rate for an ideal 'average' institutional repository: an institution will have on the order of 1,000 faculty,3 each of whom might create 10 items per working year, e.g., four articles, two presentations, a poster, a set of research data and two teaching resources. That makes a not-unreasonable figure of 10,000 items to be deposited into the institutional repository over the course of a whole year. If there are approximately 220 working days per year, then an average of 50 items would need to be deposited per day to achieve the target of 10,000 items per year. (In fact, many repositories seem to attract deposits on almost every day of the year, whether a weekend, a national holiday or part of a seasonal break.) Without an intimate statistical knowledge of institutional staffing and management practices across the world, it may be difficult to come up with a more concrete estimate for an expected deposit rate. Such a figure could be determined for a specific institution, but without global agreement on terms, like 'faculty', these measurements would be difficult to compare meaningfully. In a well-known science fiction comedy (The Hitchhiker's Guide to the Galaxy) the author Douglas Adams coined a similarly vague unit of measurement: "R is a velocity measure, defined as a reasonable speed of travel that is consistent with health, mental wellbeing and not being more than say five minutes late". In the same spirit we offer the following: D is a deposit measure, defined as a reasonable rate of ingest that is consistent with capturing the community's scientific and scholarly output. Given the very approximate estimates used to come up with a figure for D, we can make some broad statements about the expected properties of an active repository, one that is embedded into institutional processes and used by a broad range of staff. Such a repository should exhibit daily deposit activity whose graph (above) has the daily bars mainly concentrated in the central (10-100 deposits/day) region on the vertical axis. If the repository had reached the state of maturity where a thousand individuals were randomly depositing items independently of each other, and each depositor had a probability of 10/220 of depositing an item on any given day, then the Poisson distribution would predict extreme daily deposits outside the range 25-75 only once per decade. To complicate this simple model, repositories based on software such as DSpace and EPrints are designed to receive individual deposits and then marshal them into a workflow for editorial inspection and acceptance. Not all EPrints repositories insist on this; some institutions adopt the policy that visible responsiveness to faculty submissions is more important than editorial oversight that can be applied after the fact (or not at all). It may be that any system of editorial management means that deposits are inevitably going to be "batched up" to give a less-than-continuous profile in which daily deposits are dominated by one or another editor's subject specialty. This is a potential explanation for the difference between a continuous and 'gappy' deposit profile. A repository may be partitioned into a number of communities, each of which has its own editorial processes. But in a well-embedded repository, the deposits will be randomly spread across the whole institution and the whole year; that is, shared out across all the individuals and departments in an institution, and hence all the communities and collections in the repository. As such, the overall total would not be subject to the delay of any one editor in particular or to any one school's processes. Of course, each component of that total will be subjected to some delay or frustration, but taken together the repository will be subject to a range of unpredictable workflow timings whose net effect is to mitigate against very short, very high peaks (that are dozens of times greater in size than a normal day). By contrast to the effects of 'normal' repository operation, batch inputs of legacy collections (for example, existing multimedia collections or historical sets of pre-digitised Ph.D. theses) may inflate the daily figures. These pre-digitised and pre-catalogued resources can be easily adapted for high-throughput ingest and are often thought of as "low hanging fruit" as they give a repository the opportunity to easily gain in size. Such opportunities are a positive encouragement for users and managers of the repository, but they are not a replacement for genuine, broad-spectrum self- or mediated-deposits from a wide range of schools, departments, topics, and users. Infrequent, high volume deposits may make up the numbers in the early stages of a repository, but they expose potential weakness if, as special cases (existing digitised collections), they substitute for (or occlude the need for) popular (self- or mediated-) deposit on a regular basis. Self-archiving is a term commonly associated with Open Access, but even if the agenda that motivates a repository is Scholarly Collections (or Preservation, Teaching or Data Archiving), then a broad-spectrum buy-in by the faculty and research staff is a necessity to fulfill the objectives of the repository. Collecting the intellectual output of an institution's staff requires a focus on their current activities and current output, and an engagement by the staff to use the repository services to start curating and depositing their current work on a systematic basis. Monitoring Repository Deposits with ROARIn order to examine the performance of repositories according to the criteria established above, ROAR has been extended to allow examination of the daily activity of any of its registered repositories. Figure 5 shows the most main adjustment, a histogram of instantaneous daily deposits (blue) superimposed on each graph of cumulative repository sizes (green) on the main repository listing pages.
As well as linking to each repository's cumulative data as a graph or table, the user is now offered various ways of finding out the deposit activity. First, a six-year history bar chart is superimposed on the cumulative graph (as described above). Second, the number of days' deposits from the previous year are listed under three categories: counts of those days with 1-9 deposits, 10-99 deposits and 100+ deposits respectively. These three categories roughly correspond to "weak", "healthy" and "batch imports" as discussed above. These three categories have also been added to the repository-ranking menu (Figure 6), to enable a comparison of repositories on these bases. (Note that cross-institutional, thematic and departmental repositories serve communities of different sizes and should not be judged in the same way.)
Further links provide access to a static histogram of the deposit profile for the previous year (with enough space for individual days to be clearly seen and weekend breaks to be noticeable) and to a table listing each deposit on each day in the last year (together with the OAI sets in which it appears) in tab-separated text format for further analysis as a spreadsheet.
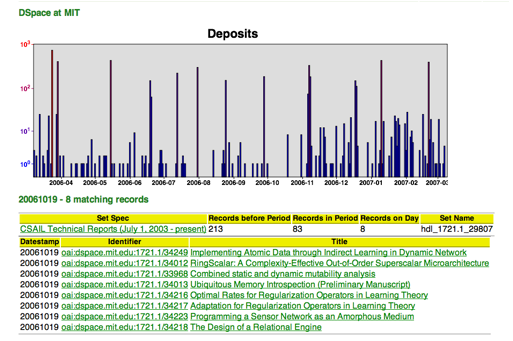
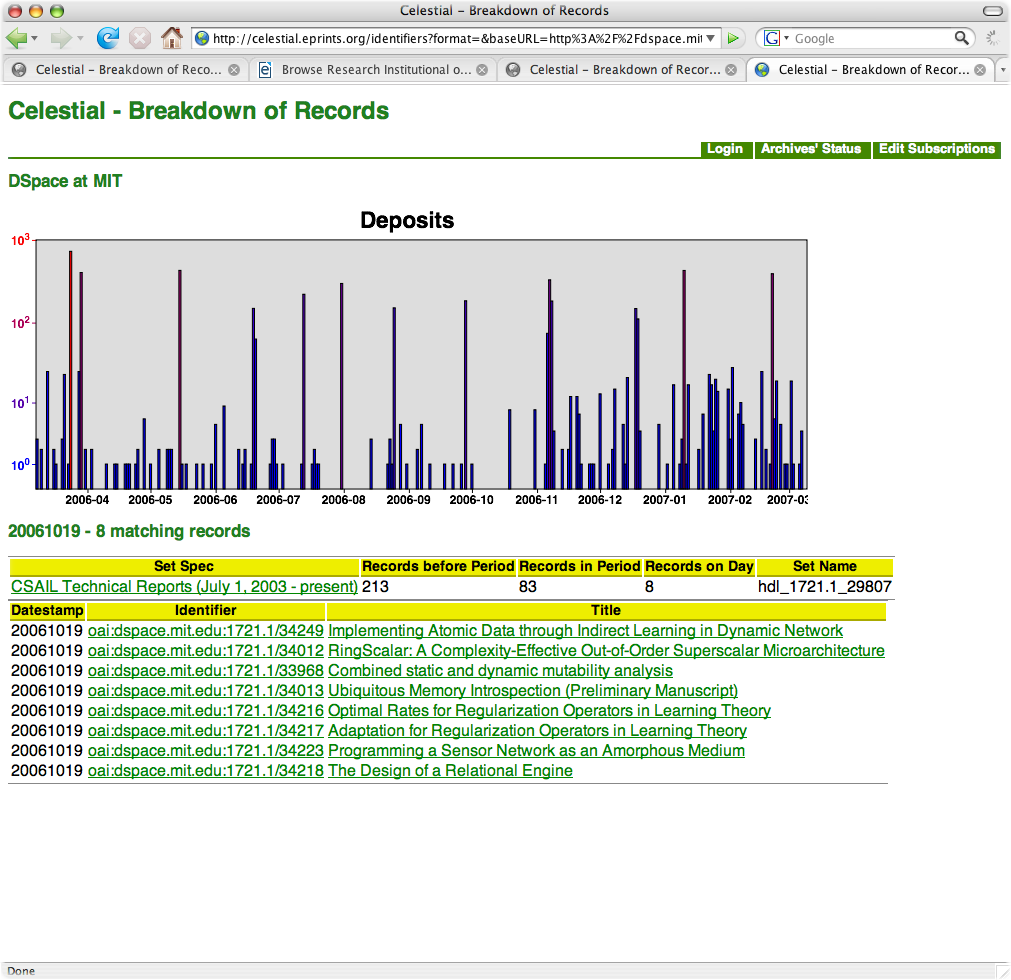
Finally, there is a link to a separate page containing an interactive graph that allows the user to select an individual day to see its OAI records and containing sets (Figure 7). On that page, each OAI identifier is linked to its harvested OAI record and also to the repository abstract page describing that OAI resource. This information is provided by Celestial, the proxy OAI-PMH harvesting service (celestial.eprints.org) that maintains the databases of OAI holdings upon which ROAR, Citebase and other services are built. Celestial has previously been used as an invisible part of the OAI infrastructure for these services, but the data that it holds is very valuable. Thus far, ROAR has relied on Celestial to create the graphs of repository sizes, and now it has been extended to allow examination of these collections of deposits in ways not normally provided by the repositories themselves. The report in Figure 7 shows that on October 19, 2006, 8 records were added to the 'CSAIL Technical Reports' set in the MIT DSpace repository. It further shows that before the start of this year there were 213 items already deposited in this set, and that during this year 83 further items were added to the set, of which 8 were added on this specific day. A Note on OAI setsMost repositories provide a mechanism for showing subject classifications or the institution's organisational structure as a prominent part of the user interface. By contrast, the OAI-PMH protocol allows a repository to divide its total collection into named 'sets' that can been seen by software harvesters (OAI service providers). The meaning of these sets is not defined by the OAI protocol, and developers are free to interpret them as they wish. Particularly, individual items may appear in many sets, or in no sets. DSpace repositories tend to use sets to reflect their collections structure, while EPrints repositories expose both the subject classifications and institutional structure. Other repositories simply maintain sets of 'published' or 'fulltext' deposits. Although sets are not a conclusive indication of the spread of deposit items, with some care in interpretation they allow the stories behind deposit peaks and troughs to be investigated, helping to determine common practice in large repositories. For example, they reveal when a large peak (or repeated peaks) results from importing items into a single (or narrow range of) topic(s) or collection(s). Using Deposit Measures to Understand RepositoriesWe applied the deposit criteria factor presented above to the twenty largest institutional repositories listed by ROAR to determine whether there is evidence of double-digit daily deposits that were spread across the whole institution during the twelve months from March 2006. In doing so, we augmented the automated statistics provided by ROAR with a manual inspection of the repositories, particularly listings of their collections (or equivalent). Each repository is categorised against double-digit daily deposits (DDDD values are Yes, No or Partial) and topical spread criteria. (SPREAD values are Yes, No, Partial or Unknown.) The results are presented in the extended table below.
Of the above list, the thematic spread of five repositories could not be determined. Of the remaining fifteen, only three repositories show definite positive results against both criteria – Utrecht, Wageningen and Southampton – while three others (Terkko, HAL and Groningen) score positively on deposits and partially on scope (although note that two of those repositories are not genuinely 'institutional'). However, if we limit ourselves to the rate of deposits and revise the 'top 20' list to be based on the number of medium-volume deposit days (i.e., days with 10-90 deposits), rather than the gross number of records, then twelve of the large but less active repositories disappear and are replaced by smaller (but more active) repositories. Six of these replacements contain fewer than 5,000 records, but it is hoped that they will grow quickly if their deposit behaviour stays constant.
CaveatsBecause OAI sets do not necessarily reflect the thematic or organisational distinctions made in the repository (if they exist), for the above study it was necessary to examine the user interface of each repository to determine how deposits were shared between the various collections or thematic areas. This usually meant examining top-level table of contents pages that contained counts for each collection, but on some occasions it was necessary to crawl the repository pages and calculate the totals with a program. Beyond that, it was frequently necessary to compare the list of collections with the University's list of faculties and schools to check the mapping between the repository structure and the University structure. In order to perform this analysis automatically it would be necessary to map a deposit item onto a collection or subject area automatically and then to map that onto the University's structure (e.g., this paper is about Cosmology; it belongs in the School of Physics and Astronomy). It would also be helpful to have an indication of the relative size of the University departments to determine the expected relative size of different schools. No such tool yet exists, but it would be very useful for future large-scale analyses of repository practice. No specific repository metric should be read in isolation – the metrics suggested here are still very coarse and do not differentiate between 10 and 90 items deposited per day. Neither do they distinguish what has been deposited – a full-text refereed journal article, a JPEG image or a metadata-only bibliographic record. In that sense they can be just as misleading as the measures of 'gross size' that they are intended to supplement. It is challenging to develop more sophisticated, content-sensitive metrics that automatically and accurately assess the holdings of a repository, as the OAI-PMH protocol does not provide a standard mechanism for declaring the data streams associated with an OAI record [Van De Sompel et al. 2004]. ROAR's Preservation Profile service tries to determine this information by data-mining the HTML contents of the repository abstract pages, though it is currently rather limited in the range of repositories to which it can be applied [Hitchcock et al. 2007]. This problem will be addressed in future services by the adoption of the forthcoming ORE standard [Van De Sompel et al. 2007]. To demonstrate the future need for a portfolio of more sophisticated metrics that account for a broad spread of desirable repository qualities, Southampton (the authors' home institution) exhibits a mixture of strengths and weaknesses: ranked 16th out of 466 repositories for size and ranked in the top three for deposit activity (above) it only has a full text percentage of 10.4% [Hey et al. 2005]. A full picture of repository effectiveness would therefore require all of these features (and more) to be taken into account. ConclusionsThis article attempts to start developing a workable metric for a reasonable rate of ingest that is consistent with capturing the community's scientific and scholarly output. Such a measure is needed both for evaluating the performance of a single repository and for comparing the effectiveness of various policies across many repositories by using registry services such as ROAR or OpenDOAR. Other services (thematic, rather than institutional) have been similarly analysed elsewhere (Carr et al. 2000). This article presents some criteria for judging the success of an institutional repository that are based on the generic requirements of repositories and are not specific to a particular agenda. The daily deposit rate is relatively easy to monitor and gives some concrete insight into the running of a repository. The fact that so few repositories scored high on the combined 'daily deposit volume and scope' measure indicates that the informal requirements are rather more difficult to achieve than expected. Even though the calculations that indicated an expected daily deposit rate of 50 items were relaxed significantly to allow a range from 10 to 99 items, it would appear that these should not be taken as widely achievable rate at this time. As well as the level of daily deposits, further work should be undertaken to determine the most suitable form of a daily rate metric – in this study the 'number of active days per year' was taken, whereas a weighted combination of the number of days and size of each day's deposit may be more useful. Despite the need to perform such calculations with a minimum of human intervention, such a metric should also be tailored to reflect the size and circumstances of the institution so as to be fair enough to gain popular acceptance. The twenty largest repositories listed above have a gross average daily deposit rate of 100 items per day – a figure that is inflated by high-volume batch deposits. However, even the lower estimated target of 50 items per day may still impose a significant resourcing problem on repository management. What degree of staff effort is required to handle such a level of activity from the combined faculty, and what are the implications for the editorial and quality oversight that are to be applied to the ingested resources? A high throughput is an intrinsically desirable goal, but it is not without its costs. In the future, it is likely that a formidable suite of administration and quality management tools will need to be deployed to support a mature repository that is seriously engaged with its faculty. Notes1. OpenDOAR also characterises repositories by policy – arguably a contributing factor to success. 2. Although OAI records are date stamped according to the time that their data was last changed, Celestial creates an accession date for each item so that it does not appear to be re-deposited when its metadata is updated. 3. UK institutions commonly returned 1,000 – 1,500 tenured research active staff in the last national research assessment exercise. Organisations of the order of 100 staff are probably departments and not independent institutions; those of the order of 10,000 staff are more likely to be consortia. BibliographyCarr, L., Hitchcock, S., Hall, W. and Harnad, S. (2000) A usage based analysis of CoRR. ACM SIGDOC Journal of Computer Documentation 24(2) pp. 54-59. Davis, P.M. and Connolly M. J. L. (2007) Institutional Repositories: Evaluating the Reasons for Non-use of Cornell University's Installation of DSpace. D-Lib Magazine, March/April 2007 13(3/4). <doi:10.1045/march2007-davis>. Hey, J. M. N.; Simpson, P; Carr, L. A. (2005): The TARDis Route Map to Open Access: developing an Institutional Repository Model. In, Dobreva, Milena and Engelen, Jan (Eds.) ELPUB2005 From Author to Reader: Challenges for the Digital Content Chain: Proceedings of the 9th ICCC International Conference on Electronic Publishing, Katholieke Universiteit Leuven, Leuven-Heverlee, Belgium, 8-10 June 2005. Leuven, Belgium, Peeters Publishing, 179-182. <http://eprints.soton.ac.uk/16262/>. Hitchcock, S., Brody, T., Hey, J.M.N. and Carr, L. (2007) Digital Preservation Service Provider Models for Institutional Repositories: Towards Distributed Services, D-Lib Magazine, June/July 2007 13(5/6). <doi:10.1045/may2007-hitchcock>. Lynch, C. (2003): Institutional Repositories: Essential Infrastructure for Scholarship in the Digital Age. ARL Bimonthly Report 226, <http://www.arl.org/newsltr/226/ir.htm>. Van De Sompel, H., Lagoze, C. and Nelson, M.L. (2007) OAI Object Re-Use and Exchange. Presentation at CERN Workshop on Innovations in Scholarly Communication (OAI5). Video: <http://indico.cern.ch/materialDisplay.py? contribId=3&sessionId=14&materialId=0&confId=5710>; slides: <http://indico.cern.ch/getFile.py/access? contribId=3&sessionId=14&resId=0&materialId=slides&confId=5710>. Van de Sompel, H., Nelson, M. L., Lagoze, C. and Warner S. (2004) Resource Harvesting within the OAI-PMH Framework. D-Lib Magazine, December 2004, 10(12). <doi:10.1045/december2004-vandesompel>. Xia, J. and Sun, L. (2007) Assessment of Self-Archiving in Institutional Repositories: Depositorship and Full-Text Availability, Serials Review, 33(1) pp 14-21. <doi:10.1016/j.serrev.2006.12.003>. Copyright © 2007 Leslie Carr and Tim Brody |
||||||||||||||||||||||||||||||||||||||||||||||||||||||||||||||||||||||||||||||||||||||||||||||||||||||||||||||||||||||||||||||||||||||||||||||||||||||||||||||||||||||||||||||||||||||||||||||||||||||||||||||||||
| |
||||||||||||||||||||||||||||||||||||||||||||||||||||||||||||||||||||||||||||||||||||||||||||||||||||||||||||||||||||||||||||||||||||||||||||||||||||||||||||||||||||||||||||||||||||||||||||||||||||||||||||||||||
|
Top | Contents | ||||||||||||||||||||||||||||||||||||||||||||||||||||||||||||||||||||||||||||||||||||||||||||||||||||||||||||||||||||||||||||||||||||||||||||||||||||||||||||||||||||||||||||||||||||||||||||||||||||||||||||||||||
| | ||||||||||||||||||||||||||||||||||||||||||||||||||||||||||||||||||||||||||||||||||||||||||||||||||||||||||||||||||||||||||||||||||||||||||||||||||||||||||||||||||||||||||||||||||||||||||||||||||||||||||||||||||
|
D-Lib Magazine Access Terms and Conditions doi:10.1045/july2007-carr
|
||||||||||||||||||||||||||||||||||||||||||||||||||||||||||||||||||||||||||||||||||||||||||||||||||||||||||||||||||||||||||||||||||||||||||||||||||||||||||||||||||||||||||||||||||||||||||||||||||||||||||||||||||
