D-Lib Magazine
September/October 2016
Volume 22, Number 9/10
Table of Contents
Quantifying Conceptual Novelty in the Biomedical Literature
Shubhanshu Mishra and Vetle I. Torvik
University of Illinois at Urbana-Champaign
{smishra8, vtorvik}@illinois.edu
DOI: 10.1045/september2016-mishra
Printer-friendly Version
Abstract
We introduce several measures of novelty for a scientific article in MEDLINE based on the temporal profiles of its assigned Medical Subject Headings (MeSH). First, temporal profiles for all MeSH terms (and pairs of MeSH terms) were characterized empirically and modelled as logistic growth curves. Second, a paper's novelty is captured by its youngest MeSH (and pairs of MeSH) as measured in years and volume of prior work. Across all papers in MEDLINE published since 1985, we find that individual concept novelty is rare (2.7% of papers have a MeSH ≤ 3 years old; 1.0% have a MeSH ≤ 20 papers old), while combinatorial novelty is the norm (68% have a pair of MeSH ≤ 3 years old; 90% have a pair of MeSH ≤ 10 papers old). Furthermore, these novelty measures exhibit complex correlations with article impact (as measured by citations received) and authors' professional age.
Keywords: Bibliometrics; MEDLINE; Novelty
1 Introduction
In principle every published paper should have one or more novel aspects to it. However, not all papers are equally novel. Some papers introduce new, never before described ideas, while others increment or confirm established ones. Here we propose several measures of novelty guided by a literal interpretation of novelty as a function of time isolated from value, impact, or creativity. This allows us to study the intrinsic contribution of time as an aspect of novelty.
We argue that it should be measurable at the time of publication while the value and impact of any idea reflects what happens (long) after publication. A quantifiable measure of novelty of an article can help scholars in tracing the origin of concepts in science. Previously, scholars have used various methods for measuring novelty of an article and studied its correlation with its impact as well as correlation with collaboration patterns [19, 13, 12, 18]. Scholar's have also argued that novelty plays an important role in the evolution of science [19], while maintaining that novel articles are rare [19] and might not get enough attention early on [11, 16]. Additionally, novelty has also been identified as new ideas [13, 12, 18] or unconventional pairings of exiting ones [19]. However, many of these methods suffer from issues related to noisy identification of relevant concepts [13, 12, 18] or don't identify what concepts make an article novel [19]. We try to overcome this issue by using concepts identified by domain experts in a large corpus of biomedical articles and quantifying how novel the individual and pair of concepts on every article are.
We measure the scientific novelty of articles using a data set of 22.3 million articles published in MEDLINE. Each article is tagged with set of Medical Subject Headings (MeSH), where each term is part of a larger hierarchy called MeSH tree. We propose the usage of MeSH terms for identifying a standardized set of important biomedical concepts mentioned in an article. Furthermore, for each article, its publication year is also recorded. Using the complete MEDLINE corpus we created a temporal profile for every individual and pair of concepts ever mentioned. Additionally, we propose a logistic growth curve for modelling four common temporal phases of a concept: (1) initial burn in, characterized by slow growth in the number of articles on the concept, followed by (2) rapid growth in publications related to the concept, leading to (3) a phase where growth starts to slow down, and finally (4) a near constant growth phase. Our model captures the various temporal trends for a majority of the MeSH terms in MEDLINE. These temporal profiles of individual and pair of concepts are then utilized for computing various novelty scores for every MEDLINE article. Our analysis of these article level novelty scores reveal that individual topic novelty is rare in bio-medicine while combinatorial pairing of concepts is the norm. Aggregation of the novelty scores for 150,000 prolific authors (> 50 papers) reveal a complex trend in how the novelty of articles published by the author changes across his/her career. For a majority of the authors the average novelty of their articles goes down during their career span. However, there is an even split between authors whose average combinatorial novelty of articles goes either up or down, as they age. Additionally, there is no consistent pattern indicating at what point in their professional career do authors publish their most novel work. Our article level novelty scores have a significant but weak predictive correlation with scientific impact (measured using citations received). We release a data set containing temporal profiles of all individual and pairs of MeSH terms in MEDLINE as well as pre-computed novelty scores for all articles, via an interactive user interface, GIMLI.
2 Related Works
Novelty, originality, and priority are three important concepts related to scientific publishing [10]. Some scholars have discussed novelty as being related to newness while others relate it to interestingness. Scholars who study the growth of science directly or indirectly have commented on the aspect of novelty, originality or innovation in science. Thomas Kuhn suggests that science moves forward through innovation and work on novel concepts [7]. Dirk uses a self-reported survey of the authors of Citation Classic papers in the biomedical field to adjudge the novelty of a paper using the topology of scientific originality based on the structural analysis of the paper [3]. The author defines novelty as a permutation of the novelty of the following three sections of the paper: Hypothesis, Methods and Results. Using a small sample of 209 articles the author reports that most papers have the following topology: new hypothesis/previously-reported methods/new results. Even though the study is focused on a small subset of articles, it establishes the need to understand novelty of a paper and identify its novel elements. However, a survey based approach is not feasible for a corpus as large as MEDLINE. Hence, there is a need for a more computational approach towards identifying novelty of a paper.
Trapido [18] discusses the effects of novelty on the recognition of authors. Their work shows that highly novel articles are at a higher risk of rejection. However, authors who have a history of publishing novel articles generally receive positive feedback for their future novel works. Additionally, disciples of authors with a history of novel publications tend to publish novel work. Recent work has shown that bibliometric indicators like early citation counts are biased against novel articles [16] and novel articles are more likely to be published in low impact factor journals. Uzzi et al. [19] define novelty of an article as a measure of its combination of cited journals, where every journal signifies a respective domain of science. Using a corpus of 17.9 million Web of Science articles from multiple fields, the authors argue that most articles have a high propensity for citing a conventional combination of journals, while few papers cite novel combinations. Their work claims that the highest impact articles demonstrate a mix of high conventional combination as well as introduce some novel combinations.
Teams are more likely to work on novel combinations compared to solo authors. Packalen et al. [13, 12] define novelty as newness of the concepts mentioned in an article. The authors describe a word/phrase-based analysis for identifying novel ideas in the MEDLINE database [13]. They manually remove synonyms of popular ideas and replace them with words with more canonical meaning. Their methods are limited to finding novel articles on popular ideas and only consider novelty of single ideas in a paper. Correlation of novelty with authors' professional age shows that younger authors co-author most of the novel work. The presence of an experienced co-author is correlated with higher novelty of that article. Methods for measuring novelty can be effectively applied to patent corpuses as their structure is similar to bibliometric corpuses of research articles, making these methods useful for a broader community of researchers.
In [12], Packalen et al. extend their approach from [13] for finding novel ideas in USPTO patents data set [12]. Youn et al. [20] discuss the combinatorial aspect of invention in patents and describe that the process exhibits a pattern of exploration and exploitation of new technologies. Schoenmakers et al. [14] discusses patterns of novelty in patents using an empirical examination of 157 patents. The authors find that radical inventions are based more on existing knowledge than non-radical inventions. They further explain that radical innovation is mostly a result of the combination of different knowledge domains. Evans et al. [5, 4] also present a detailed review of the various methods used for quantifying novelty in various fields.
The preceding works have motivated us to devise a simple yet consistent method of quantifying novelty of articles. We build upon some preliminary work presented in [8, 9] and present the details of our methods and the corresponding results in the sections which follow.
3 Temporal Profile of a Concept
Novelty scores capture the age of a concept (or pair of concepts) as measured in years (or number of prior articles) since its first appearance in the corpus, henceforth also referred to as empirical novelty scores. It is important to note that a more novel article will have a lower empirical novelty score and vice versa. We discuss the following two types of novelty in this paper:
- Time novelty is based on the number of years since the first appearance of a concept in the corpus.
- Volume novelty is based on the number of articles since the first appearance of a concept in the corpus.
Absolute value of number of articles on a concept (C) in an year (y) (Nc,y), is a noisy indicator of the growth patterns of that concept in MEDLINE as MEDLINE itself has grown exponentially through time. This automatically results in more papers on a concept in later years, which do not signify the growth of this concept relative to the growth of MEDLINE. To account for this effect, we define a log normalized count of articles (Nec,y) on concept C in year y as the log of Nc,y multiplied by a normalizing factor (Zy), such that Zy is the ratio of mean number of articles in MEDLINE and total articles in MEDLINE in year y. Hence, Nec,y = ln(1 + Nc,y * Zy).
Upon empirical observation of the temporal profile of concepts in MEDLINE, we found that most concepts' growth in MEDLINE is defined by the following four phases:
- Burn-In Phase: Topic is new, publication rate is small, and growth is marginal.
- Accelerating Growth Phase: Topic is bursting, publication rate is rapidly increasing.
- Decelerating Growth Phase: Publication rate is still increasing but is starting to stabilize.
- Constant Growth Phase: Growth is marginal and publication rate has stabilized.
In order to capture the above phases for each concept, we model f(t) = Nec,t as a function of age (t) of the concept measured in years, such that
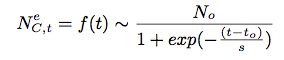
where, Nec,t is Nec,y such that t = y — yo, yo is the first year after 1965, when the concept was used, No captures asymptotic max value the concept can attain, to captures the age when the concept goes from accelerating to decelerating growth phase, s captures temporal spread of both the growth phases. (Note that MeSH terms were introduced in 1965, hence data is very sparse for years before 1966 and many articles are indexed with few MeSH terms. This is important for proper curve fitting using least squares.)
Using the model described above, we also define the velocity and acceleration of a concept as f'(t) and f"(t), respectively.
4 Novelty of Articles in MEDLINE
This section explains how we assign a novelty score to each article in MEDLINE.
4.1 Data
For generating the novelty scores we consider 22.3 million the articles published in MEDLINE between 1902 and 2015. Our study uses 27,249 MeSH terms as a basis for identifying the concepts of a MEDLINE article. (We use the 2015 MeSH tree.) From Figure 1, the rapid growth of MEDLINE after 1945 is quite evident. We also observed that the number of MeSH terms first indexed in a year saw a sharp spike in 1945, and after 1985 this trend has been stable. Similarly, the mean number of MeSH terms in an article has a steady trend of an average of 2 MeSH terms per year since 1985.
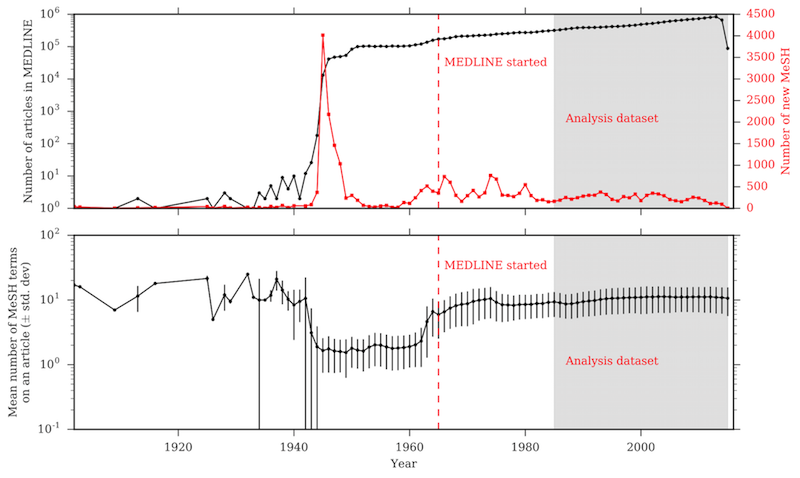
Figure 1: TOP: Growth of MEDLINE across the years and number of new MeSH terms added each year. BOTTOM: Mean number of MeSH terms used to index articles in MEDLINE across years. MEDLINE was started in 1965 and a lot of noise — with regard to many MeSH terms being wrongly spelled or older articles being indexed by too few MeSH terms — is present in our corpus around those years. The data after 1985 (shaded grey and marked as Analysis data) has a stable growth and is used for most of the results presented in the Results section.
MeSH terms are assigned by experts from National Institute of Health (NIH), resulting in a consistent identification of concepts in the article. This is a major reason for our choice of using a control vocabulary like MeSH. Another reason is that only well recognized concepts are included in the MeSH vocabulary, ensuring articles which coin new terms, not recognized by the National Library of Medicine (NLM), are not marked as novel by us. In a similar research work described in [13, 12], the authors use words and phrases extracted from the title and abstract of an article. We argue that these features suffer from several limitations of NLP based information extraction systems, mainly disaggregation of name variants and spelling errors for words and phrases describing the same concept. In [19], the scholars use co-citation of articles in defining the novelty of an article across four categories. This approach doesn't allow us to identify the novelty of an article across multiple fields. On average an article is indexed using 9.6 (±5.0) MeSH terms with the maximum MeSH terms for an article being 103 while the minimum is 1. On average each article contributes towards the novelty score of 45.5 (±22.9) MeSH terms, after each of the article's terms are exploded.
4.1.1 Generating temporal profiles for MeSH terms
Articles in MEDLINE are indexed using MeSH terms that are organized in a hierarchy, although it should be noted that some terms have multiple parents. For example, Breast Neoplasms has two MeSH IDs, C04.588.180 and C17.800.090.500, which point to their positions in the hierarchy:
- Neoplasms [C04] → Neoplasms by Site [C04.588] → Breast Neoplasms [C04.588.180]
- Skin and Connective Tissue Diseases [C17] → Skin Diseases [C17.800] → Breast Diseases [C17.800.090] → Breast Neoplasms [C17.800.090.500]
A PubMed search for articles in MEDLINE, on any MeSH term, also lists the articles for any of its children MeSH terms. This means that for counting the number of articles published for a MeSH term, we can use the total number of articles index by that MeSH term or any of its children in the MeSH tree. For example, in the case of Neoplasms (Cancer), a growth in the number of publications about Neoplasms should not be gauged by a growth in the number of papers mentioning the exact MeSH. A growth in the number of publications involving any of the child terms should also be considered towards the growth of usage of the MeSH term Neoplasms. We count an article mentioning any children of a MeSH term as an article in the parent MeSH. This results in having a better estimation of how research has progressed in rarer MeSH categories. The list of MeSH in an article is considered to be a list of all exploded MeSH terms. So if an article has a MeSH term list with Breast Neoplasms, then the exploded MeSH list will be [Breast Neoplasms, Neoplasms by Site, Neoplasms, Breast Neoplasms, Breast Diseases, Skin Diseases, Skin and Connective Tissue Diseases]. This exploded MeSH term list is used as the list of all concepts related to the article.
Some simple pre-processing steps were carried out. Misspelled terms were merged with the correct term in the MeSH tree by removing spaces and lower casing the terms. A preliminary investigation into the effect of incorrect assignment of MeSH terms by annotators at NLM was carried out by removing the spelling correction pre-processing step. But the resulting effect on the novelty scores was marginal. Additionally, the trends described in our results were not affected. We believe that errors in data such as indexing artifacts and incompleteness of the MeSH tree with respect to all the important terms in biomedical community, might also have a marginal effect on the presented results. Articles published before 1966 had multiple irregularities in assignment of MeSH terms. Hence, we only use the MeSH counts after 1965 for fitting the model to these MeSH terms. Model based scores were calculated for all MeSH terms. However, the model fitting algorithm failed to converge for 316 (1.2%) terms, most often due to sparse data or recent terms (116 were introduced after 2010). Of the MeSH terms which had more than five thousand articles, only three were introduced after 1965: Autophagy; Protein Multimerization; and Influenza A Virus, H1N1 Subtype, while the other 97 terms were introduced before 1965 with a majority (64) of them being first used in the year 1945 (see Figure 1). A closer inspection of the temporal profile of these MeSH terms revealed two major growth periods from which the algorithm was unable to pick one. Empirical novelty scores, velocity and acceleration of all MeSH terms for each year were computed using the complete MEDLINE corpus and the methods described in Section 3. Empirical novelty scores were also computed for every pair of MeSH terms for each year.
Figure 2 shows the profile of the HIV MeSH term in our dataset. We can observe that the data for HIV fits perfectly with our model and we observe the four distinct phases of growth of the MeSH term. Specifically, 1986 is the year the term enters a Decelerated growth phase and soon after that it enters a Constant growth phase. The observations are interesting because AIDS was first clinically discovered in 1981 and HIV was discovered in 1983 under two different names LAV [6] and HLTV-III [1], which matches clearly the accelerated growth in research on this topic. The terms were renamed HIV in 1986. We found that there were no articles mentioning HIV directly before 1986. This also proves why our method is robust in identifying the initial phases of a concept by using the exploded MeSH tree, merging name variants and fixing common spelling issues.
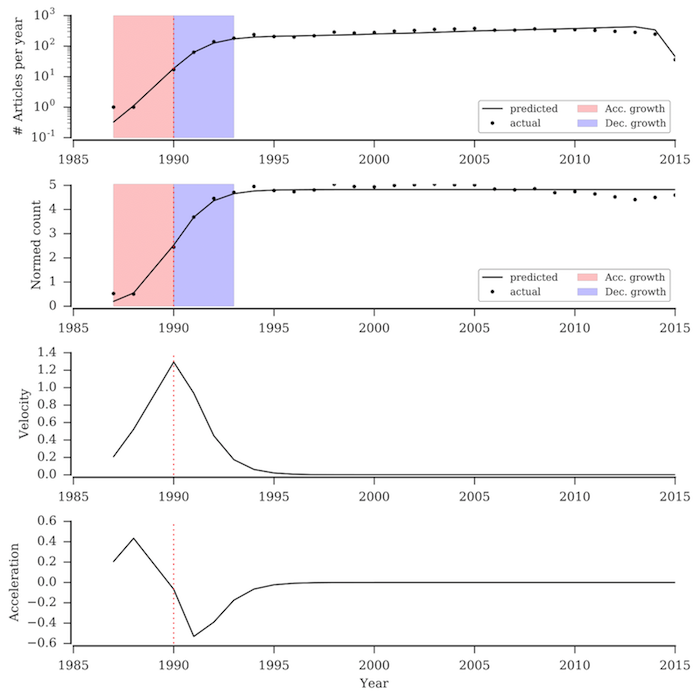
Figure 2: Temporal profile of MeSH term HIV including describing the empirical as well as predicted trends using our model. The figure describes the rapid growth in publications on HIV around 1985 marking a four year period of accelerated growth followed by a three year period of decelerated growth leading into a final phase of constant growth. The model was fitted on the normed count and the predicted values were rescaled to predict the actual number of articles on the concept.
4.1.2 Assigning novelty scores to an article
The following empirical novelty scores are assigned to each article:
- Minimum concept age (years) or Individual time novelty: Minimum concept age in years among all concepts on the article.
- Minimum concept-pair age (years) or Pairwise time novelty: Minimum concept-pair age in years among all concepts-pairs on the article.
- Minimum concept age (papers) or Individual volume novelty: Minimum concept age in papers among all concepts on the article.
- Minimum concept-pair age (papers) or Pair-wise volume novelty: Minimum concept-pair age in papers among all concepts-pairs on the article.
Using the velocity and acceleration of every concept on an article, the following growth scores are also assigned to every article:
- Accelerated minimum growth: Minimum velocity among all concepts in the accelerated phase.
- Accelerated maximum growth: Maximum velocity among all concepts in the accelerated phase.
- Decelerated minimum growth: Minimum velocity among all concepts in the decelerated phase.
- Decelerated maximum growth: Maximum velocity among all concepts in the decelerated phase.
Figure 3 shows the profile of an article published in MEDLINE in the year 2001. This was one of the first articles on microRNAs. As is evident from the figure, the most novel MeSH term in the article in microRNAs resulted in a Individual time novelty score of 0 and a Individual volume novelty score of 2. We also observe that the term has multiple pairs of MeSH terms occurring for the first time because of the novel nature of this paper, resulting in a Pairwise time novelty score of 0 and Pairwise volume novelty score of 1.
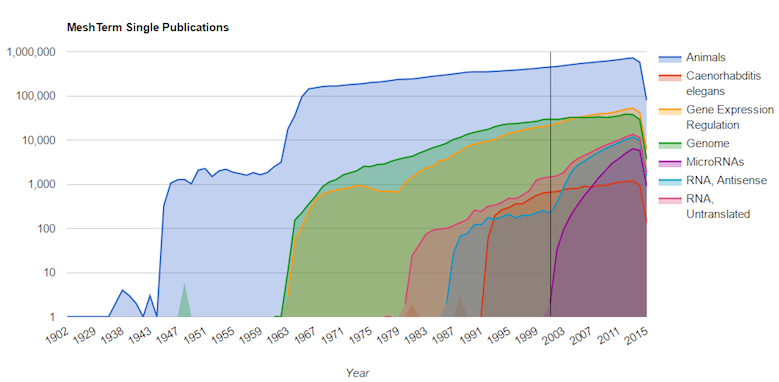
Figure 3: Temporal profile of all MeSH terms listed on PubMed ID 11779458 published in 2001, one of the first few papers listed for the MeSH term microRNAs. microRNAs saw a rapid growth after their introduction and MeSH terms like RNA Untranslated and RNA Antisense also experienced a phase of rapid growth in research output during the same years. MeSH terms like Animals, Genomes and Caenorhabditis elegans appear to be in their constant growth phase.
5 Results and Discussion
In this section we describe how our novelty scores can be utilized to study the distribution of novelty in biomedical literature, careers of authors and impact of an article.
5.1 Distribution of novelty scores in MEDLINE
Novelty scores were generated for all the articles in MEDLINE. A subset of 15.1 million articles published in MEDLINE after 1985 (as shown in Figure 1) was considered for the analysis of the distribution of novelty scores. Figure 4 shows the cumulative distribution of the various novelty scores. Using a cut-off of 3 years for time novelty scores and 20 years and 10 years for individual and pairwise volume novelty scores, respectively, we find that individual concept novelty is rare in MEDLINE. The distribution of novel articles with respect to our cutoff values are shown in Table 1. Further, it appears that pairwise novelty scores are better at capturing the prevalent kind of novelty in articles.
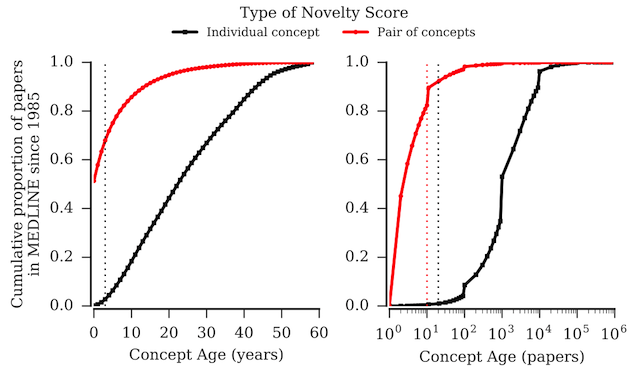
Figure 4: Cumulative distribution of novelty scores for 15.72M (15.71M with at-least a pair of MeSH terms) articles published in MEDLINE since 1985. Lower is more novel. Colored dotted lines represent the respective cutoff for marking an article novel.
| |
Age |
| Novelty type |
(years) |
(papers) |
| Individual concept |
2.73% (< 3) |
1.0% (< 20) |
| Pair of concepts |
68.0% (< 3) |
89.6% (< 10) |
Table 1: Proportion of novel articles identified using specified cutoff for different novelty scores
An interesting trend depicted in Figure 4 is that for a majority of articles, their most novel individual concept is more than 1,000 prior papers. This might reflect a trend in the biomedical community of working on well established concepts, but at the same time quickly adopting new pairings of terms. From the figure it is also evident that the volume novelty scores are capturing more granular levels of novelty compared to time novelty scores. The model based novelty score identifies 61.1% of the articles, which have at least one concept fitting our model specification, a concept in an accelerated growth phase, where as 38.9% of articles have no concept in such phase. This might reveal that a majority of scientific articles are published on at least one topic which is hot at that time.
5.2 Modeling change in novelty across an author's career
How does the novelty of articles published by an author changes across his/her career? In order to answer this question, we consider a subset of Authority data set [17] of all authors who have published at least 50 papers and have started their careers after 1965. This results in a data set of 150K authors. For each author, a linear model was fitted for the log value of novelty scores (y) of each of their articles versus the professional age of the author x, measured as the years since the first publication by the author in MEDLINE. For every author, the model log10(1 + y) ~ mx + c is fitted using least squares method and slope m is recorded. If m ≥ 0, we infer that the average novelty of papers across an author's career is decreasing (higher novelty score means less novel paper). Similarly, if m < 0, the author is considered, on average, to publish more novel papers later in their career. Similarly, we also fit a model only on the minimum novelty scores per year of an author's career.
Table 2 presents the proportion of authors who have a decreasing novelty across their careers. We observe that a majority of the authors (85%) have a decreasing individual concept novelty across their careers. On the contrary, the proportion of authors who have decreasing concept-pair novelty (60%) is only slightly different from those who have an increasing concept pair novelty (40%) across their careers.
| |
Novelty |
| Type of novelty |
Average |
Minimum |
| Concept Age (years) |
84% |
59% |
| Concept Age (papers) |
85% |
58% |
| Concept-pair Age (years) |
64% |
67% |
| Concept-pair Age (papers) |
56% |
68% |
Table 2: Proportion of authors with increasing average novelty of articles over careers
These results indicate that the average novelty of articles published by most of the prolific authors (> 50 papers in MEDLINE) decreases as their career progresses. However, exactly when these authors published their most novel articles didn't have any specific trend. Further investigation revealed that an author's most novel articles based on either of the novelty scores can occur any time in their career, but are less likely to occur at the beginning of their career. The relation of an author's mean article novelty with the author's age also varied based on when that author started his/her career. These patterns indicate that the relationship of an author's age with the novelty of their article is rather complex.
5.3 Correlation of novelty with impact
One of the most common evaluations of any bibliometric measure is its correlation with the impact measured in terms of citation count. We use the citation information available using a collection of Web of Science PubMed citations, Microsoft Academic Graph [15] and PubMed Central. The impact of an article is measured in the following ways:
- Total citation count
- Journal normalized citation score, which normalizes the citations received by an article using the average citations received by all articles published in that journal in the same year.
Analyzing the correlation of our novelty scores with the journal normalized citation score allows for comparison after removal of journal specific citation impact (e.g. articles published in high impact journals on average receive more citations compared to those published in low impact journals). The journal normalized citation score of an article published in a given journal is the ratio of the total citation count divided by the average citation counts of all articles published in the same journal in the same year.
Figure 5 shows the relation between the mean impact scores versus the various novelty scores of articles aggregated in time windows of 5 years. The figure depicts a positive correlation between more novel articles and higher impact scores. However, the trends are not consistent across the years and we observed that the articles on novel individual concepts, which were published in more recent years, have lower impact scores. No such trend was visible in articles on novel pairs of concepts in the same years. This might suggest that articles which introduce completely new topics take some time to achieve their potential impact as has been discussed in an earlier literature [16], however articles which are among the first few to merge existing topics require less time to achieve their potential impact. A possible reason for the observation of this trend might be that there is slow adoption of research in new concepts in the biomedical community, resulting in a low impact of articles published on these concepts in their earlier years, but as the concepts age, a larger number of papers refer to these concepts leading to higher impact later on. We plan to further investigate this effect of novelty on rate of gaining impact in our future analysis.
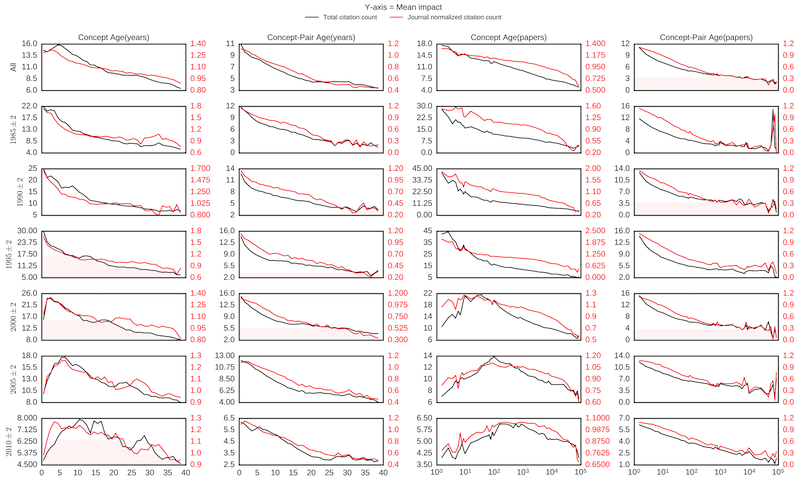
[ See large version of Figure 5. ]
Figure 5: Novelty scores correlated with mean impact as measured using total and journal normalized citation count. Y axis in each sub plot represents the mean impact (black — total cites, red — journal normalized). X axis in each subplot column measures the concept age as denoted in the column title.
A series of regression tests revealed significant (p-value < 0.001) negative correlation between novelty scores (lower is more novel) of an article and its impact measured through total citation counts and journal normalized citation score. However, our models were not very predictive (R-squared values ~ 0.1) of the impact of the article. Furthermore, inclusion of factors like mean journal citation, year of publication and number of MeSH terms improved the model's predictive ability (R-squared values ~ 0.47). This indicates that the novelty of an article is not the most significant factor which contributes towards its high impact, although it helps to be novel. Additionally, other factors such as impact of the publishing journal, reputation of listed authors, year of publication, and topic of the article might play a greater role in determining its impact.
5.4 Public data set and user interface for exploration of novelty scores
In addition to our analysis and the results presented in this paper, we also make available all the novelty scores and the code generated by our model with a web-based user interface GIMLI for interactively exploring the novelty profiles of each article, along with the temporal trends of each MeSH term. Our interface also includes a feature for tracking the change in novelty across an author's career.
Figure 3 is an example of the temporal profiles of all the MeSH terms presented on an article. Figure 6 shows the screen shot of our web page displaying the most novel terms across various top level categories in the MeSH tree for a given article. The interface also allows a user to explore the profile for each individual MeSH term in the MeSH dictionary, and provides a comparative view of the temporal profiles of all individual, as well as pairs, of MeSH terms on a given article. We believe this resource can be useful for researchers who are studying innovation in biomedical literature, and those who want to study trends in the growth of concepts in biomedicine.
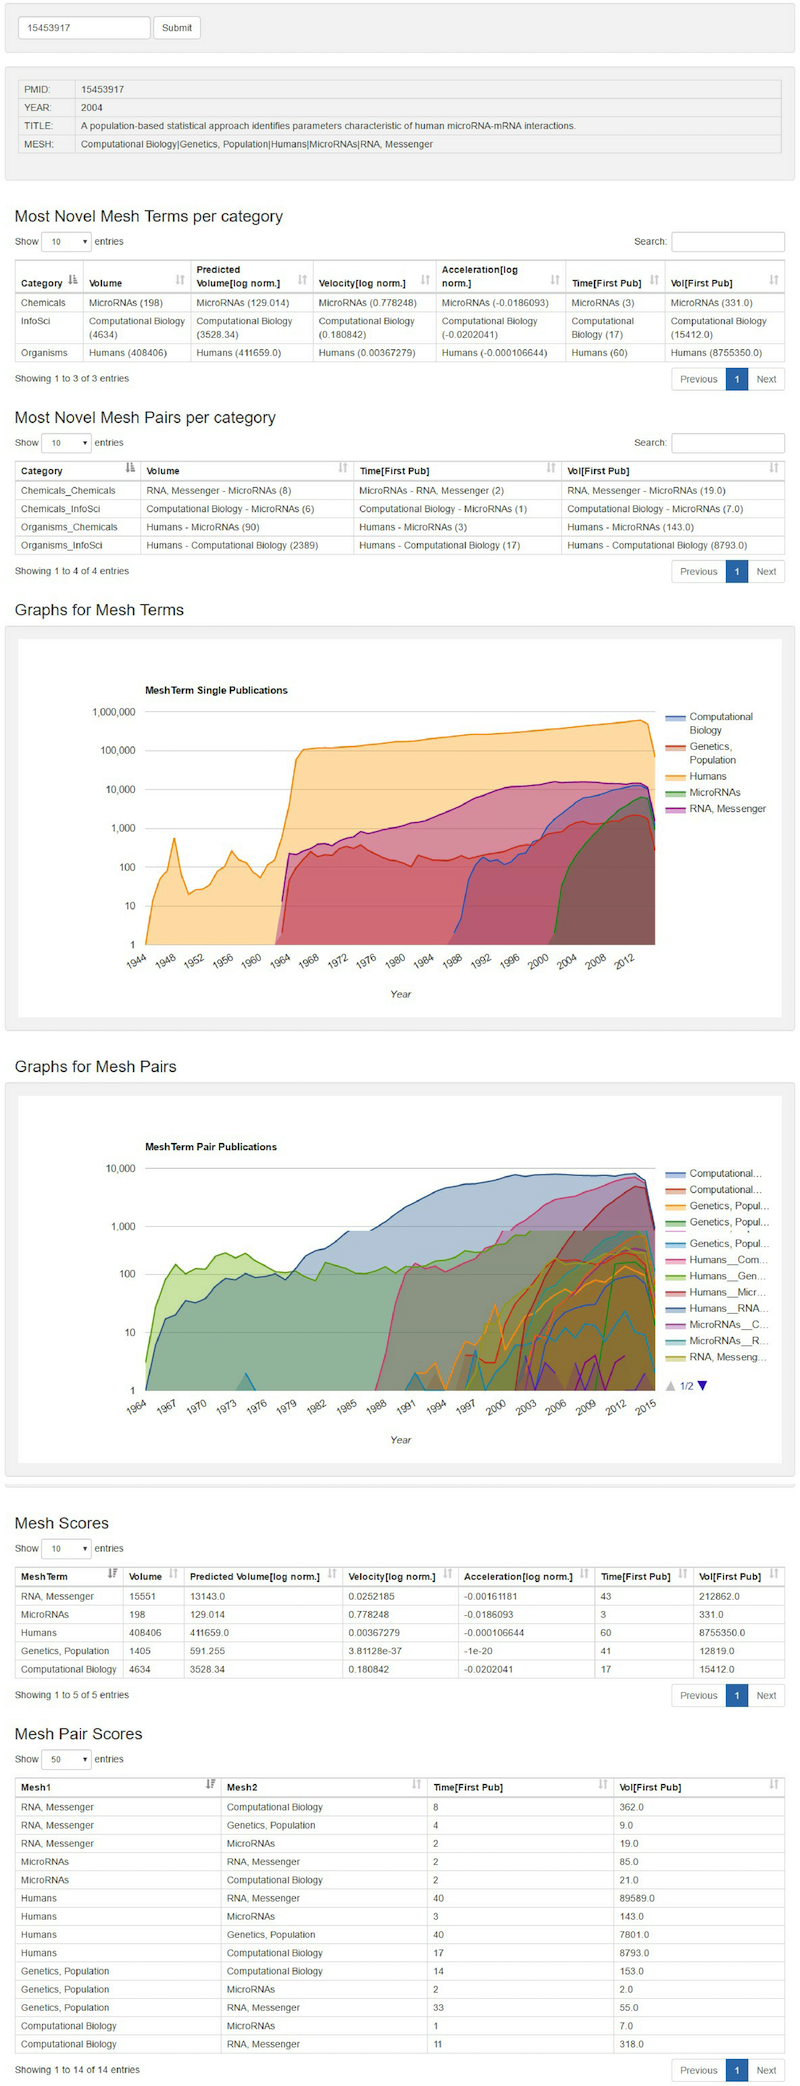
Figure 6: Screen shot of the web interface GIMLI for exploring novelty profiles of articles in MEDLINE, temporally modelled growth of individual MeSH terms, and change in novelty across an author's career. Figure 6 shows the novelty profile of an article indexed by the listed MeSH terms. The profile of every individual and pair of MeSH terms is displayed along with their empirical and model based profile scores. The interface also mentions the most novel individual and pair of concepts in top level MeSH categories, such as Drug, Disease and Organisms.
6 Concluding Remarks
We propose several measures of quantifying conceptual novelty of a MEDLINE article. From our experiments we conclude that using using individual and pairs of MeSH terms to measure novelty uncovers interesting trends in the biomedical domain. Pairwise scores are more resonant with our general idea of novelty, where an article published on a combination of topics can be considered novel even if it is not novel in any of its individual topics. By modelling the change in novelty across an author's career we discover that, for the majority of the authors, the average individual concept novelty of their published articles goes down as they age. However, authors might publish their most novel work at any time during their careers.
Our measures uncover a complex relationship between novelty and the impact of an article. The methods presented here for quantifying the novelty of an article can be applied to any corpus, given that the articles are annotated with a consistent hierarchical set of categories, e.g. ACM Computing System Classification for ACM articles [2] or Microsoft Academic Graph's hierarchy of fields of study and paper keywords [15]. We complement our study with an online resource which allows a user to visually inspect the temporal profiles of all the MeSH terms assigned to a given MEDLINE article. Our system uses pre-computed novelty scores to present the most novel concepts in an article, aggregated into relevant biomedical categories such as Drug, Disease and Organism. Other scholars can utilize our data set of novelty scores in studying the evolution of concepts in biomedical literature.
Acknowledgements
Research reported in this publication was supported in part by the National Institute on Aging of the NIH (Award Number P01AG039347) and the Directorate for Education and Human Resources of the NSF (Award Number 1348742). The content is solely the responsibility of the authors and does not necessarily represent the official views of the NIH or the NSF. We would also like to thank the three anonymous reviewers for their valuable feedback regarding this paper.
References
| [1] |
F. Barre-Sinoussi, J. Chermann, F. Rey, M. Nugeyre, S. Chamaret, J. Gruest, C. Dauguet, C. Axler-Blin,
F. Vezinet-Brun, C. Rouzioux, W. Rozenbaum, and L. Montagnier. Isolation of a t-lymphotropic retrovirus from a patient at risk for acquired immune deficiency syndrome (aids). Science, 220(4599):868-871, 1983. http://doi.org/10.1126/science.6189183 |
| [2] |
N. Coulter. ACM'S computing classification system reflects changing times. Communications of the ACM, 40(12):111-112, December 1997. http://doi.org/10.1145/265563.265579 |
| [3] |
L. Drik. A Measure of Originality: The Elements of Science. Social Studies of Science, 29(5):765-776, October 1999. http://doi.org/10.1177/030631299029005004 |
| [4] |
J. Evans and J. Foster. Measuring Novelty by Simulating Discovery. 2015. |
| [5] |
J. A. Evans. Industry Induces Academic Science to Know Less about More. American Journal of Sociology, 116(2):389-452, 2010. http://doi.org/10.1086/653834 |
| [6] |
R. Gallo, P. Sarin, E. Gelmann, M. Robert-Guroff, E. Richardson, V. Kalyanaraman, D. Mann, G. Sidhu, R. Stahl, S. Zolla-Pazner, J. Leibowitch, and M. Popovic. Isolation of human t-cell leukemia virus in acquired immune deficiency syndrome (aids). Science, 220(4599):865-867, 1983. http://doi.org/10.1126/science.6601823 |
| [7] |
T. S. Kuhn. The Structure of Scientific Revolutions, volume II. University of Chicago Press, 1970. |
| [8] |
S. Mishra and V. I. Torvik. Measures Of Novelty And Growth For Bibliometrics, March 2014. http://hdl.handle.net/2142/49962 |
| [9] |
S. Mishra and V. I. Torvik. Measures of Novelty in Biomedical Literature, March 2016. http://hdl.handle.net/2142/89694 |
| [10] |
P. P. Morgan. Originality, novelty and priority: Three words to reckon with in scientific publishing. Canadian Medical Association Journal, 132(1):8-9, January 1985. |
| [11] |
J. M. Nicholson and J. P. A. Ioannidis. Research grants: Conform and be funded. Nature, 492(7427):34-6, December 2012. http://doi.org/10.1038/492034a |
| [12] |
M. Packalen and J. Bhattacharya. Age and the trying out of new ideas. Working Paper 20920, National Bureau of Economic Research, January 2015. |
| [13] |
M. Packalen and J. Bhattacharya. New ideas in invention. Working Paper 20922, National Bureau of Economic Research, January 2015. |
| [14] |
W. Schoenmakers and G. Duysters. The technological origins of radical inventions. Research Policy, 39(8):1051-1059, October 2010. http://doi.org/10.1016/j.respol.2010.05.013 |
| [15] |
A. Sinha, Z. Shen, Y. Song, H. Ma, D. Eide, B.-J. P. Hsu, and K. Wang. An overview of microsoft academic service (mas) and applications. In Proceedings of the 24th International Conference on World Wide Web, WWW '15 Companion, pages 243-246, New York, NY, USA, 2015. ACM. http://doi.org/10.1145/2740908.2742839 |
| [16] |
P. Stephan, J. Wang, and R. Veugelers. Bias against novelty in science: A cautionary tale for users of bibliometric indicators. 2015. |
| [17] |
V. I. Torvik and N. R. Smalheiser. Author Name Disambiguation in MEDLINE. ACM transactions on knowledge discovery from data, 3(3):1-29, July 2009. http://doi.org/10.1145/1552303.1552304 |
| [18] |
D. Trapido. How novelty in knowledge earns recognition: The role of consistent identities. Research Policy, 44(8):1488-1500, October 2015. http://doi.org/10.1016/j.respol.2015.05.007 |
| [19] |
B. Uzzi, S. Mukherjee, M. Stringer, and B. Jones. Atypical combinations and scientific impact. Science, 342(6157):468-472, 2013. http://doi.org/10.1126/science.1240474 |
| [20] |
H. Youn, D. Strumsky, L. M. A. Bettencourt, and J. Lobo. Invention as a combinatorial process: evidence from US patents. Journal of the Royal Society, Interface / the Royal Society, 12(106):20150272, April 2015. http://doi.org/10.1098/rsif.2015.0272 |
About the Authors
Shubhanshu Mishra is a 4th year doctoral student of the iSchool at the University of Illinois at Urbana-Champaign. He completed a 5 year integrated bachelor's and master's degree in mathematics and computing from the Indian Institute of Technology (IIT), Kharagpur. He was a fellow of the KVPY fellowship program, funded by the department of science and technology of the government of India, from 2007 to 2012. His research interest includes using data mining, network analysis, machine learning, and text analysis techniques for studying large scale socio-economic data. More details about his work can be found at: http://shubhanshu.com/.
Vetle I. Torvik is an Assistant Professor in the Graduate School of Library and Information Science at the University of Illinois at Urbana-Champaign where he teaches courses on text and data mining, statistical modeling, informetrics, and information processing. His current research addresses problems related to scientific discovery and collaboration using complex models and large-scale bibliographic databases. He has built a suite of bibliographic data mining tools and datasets that are available from ABEL.