 |
D-Lib Magazine
November/December 2014
Volume 20, Number 11/12
Table of Contents
Experiments on Rating Conferences with CORE and DBLP
Irvan Jahja, Suhendry Effendy and Roland H. C. Yap
National University of Singapore
Corresponding Author: Roland H. C. Yap (ryap@comp.nus.edu.sg)
doi:10.1045/november14-jahja
Printer-friendly Version
Abstract
Conferences are the lifeblood of research in computer science and they vary in reputation and perceived quality. One guidance for conferences is conference ratings which attempt to classify conferences by some quality measures. In this paper, we present a preliminary investigation on the possibility of systematic unbiased and automatic conference rating algorithms using random walks which give relatedness score for a conference relative to a reference conference (pivot). Our experiments show that just using a simple algorithm on the DBLP bibliographic database, it is possible to get ratings which correlate well with the CORE and CCF conference ratings.
1. Introduction
Conferences are the lifeblood of research in computer science. There are thousands of conferences across a variety of areas. Conferences vary in reputation and perceived quality. One guidance for conferences is conference ratings which attempt to classify conferences by some quality measures. For example, CORE and CCF, are two well known and widely used conference lists which give such ratings.
In this paper, we present a preliminary investigation on the possibility of systematic unbiased and automatic conference rating algorithms. While one can argue that conference rating cannot be done automatically, the advantage of unbiased methods is that they can inform on how one might determine such ratings. Starting with a measure using random walks which gives a relatedness score for a conference relative to a reference conference (pivot) [4], we make use of a set of suitable reference pivots to systematically rate conferences. We experiment to see how well this simple algorithm correlates with the CORE and CCF ratings using the DBLP bibliographic database (DBLP). While differences in ratings between the various rating methods should be expected, the preliminary results show that our conference rating correlate reasonably well with CORE and CCF. It is surprising that a simple method which does not use any semantics, essentially graph analysis, is effective. We believe this is due to the strong correlation between the collaboration network of computer scientists with how papers are published in conferences.
2. Related Work
Scientific collaboration networks in computer science have been studied by many researchers [1, 2, 3], in particular, the DBLP author collaboration network by Elmacioglu, et al. [2]. However, there have not been many works which investigate or employ conference ratings. Bird, et al., investigated the collaboration style between authors and areas in computer science [1]. They determined the areas of interest and manually selected several conferences to represent the areas. Although they did not explicitly consider rating in their conference selection, we noticed that most of the selected conferences have a high rating. Recently, we proposed several measures of relatedness and found that the top conferences with high relatedness scores (top 10-20) correlated well with A* and A rated conferences in the CORE list [4]. This paper extends this direction to predict conference ratings.
3. Background
A scientific bibliography database, such as DBLP, contains information on paper title, authors, year of publication, publication venue (conference, journal, workshop, etc.), and many other details. Each conference c has a multiset of authors (as an author might publish many times in c), where α(c) represents the authors who publish in c. We build a conference graph from c and α(c) as follows: a conference graph G = (V, E) contains each conference c as a vertex, and each edge (ci, cj) has a weight wi,j [4]. The weight wi,j is meant to denote a relatedness measure between conferences ci and cj based on the authors publishing there and is defined by the Jaccard index on the multisets α(ci) and α(cj).The Jaccard index of sets X and Y is defined as |X ∩ Y| / |X ∪ Y|, i.e. the size of intersection over the size of union of the two sets.
The idea of relatedness measure is to relate conferences relative to a base conference called the pivot where the pivot is meant to be an influential conference, e.g., a rank A conference. In our earlier work [4], we proposed three different approaches to measure the relatedness between conferences through selected pivots, i.e. Direct Jaccard Index, Random Walk (RW), and Pivot Aggregation. It was observed that RW gives a better score for higher rated conferences if the pivot also has a high rating. Hence, in this paper we will focus on the RW measure.
In the RW approach, relatedness is measured by the expected number of times vertex i is visited in a random walk up to length L. The transition probability of visiting j from i is w'i,j obtained by normalizing the Jaccard index as w'i,j = wi,j / ωi for i ≠ j, otherwise 0, and ωi = Σj≠i wi,j . Let the i-th element of vector Rp be the RW relatedness score of conference ci to pivot p, and W' be a matrix with transition probabilities w'i,j . Rp is computed as follows where Ep(s) is a vector giving the probability for a walk of length s from p to reach a conference:
As we want to find conferences which are related (i.e. near) to a pivot, the random walk length should be short.
4. Conference Rating by Relatedness Ranking
The preliminary experiments from [4] suggested that relatedness measure to a pivot correlated well with the A*/A conference rating in CORE for the top 10-20 conferences from several areas. We now propose how to predict conference ratings from the conference relatedness measure relative to a pivot. The assumption is that given a top rated pivot conference, conferences in the area whose relatedness measure is closer to the pivot are also expected to have a rating closer to the pivot. Correspondingly, conferences which are less related are expected to have a lower rating. Every conference can be scored by its rank relative to the pivot; a lower rank means that its relatedness score is closer to the pivot.
However using a single pivot is likely not sufficient. This is because the rating for a conference is typically connected to only particular areas or topics, e.g. the rating for conferences in the database area may not be meaningful in a graphics context. As such, we will consider a set of top rated pivot conferences, to give good coverage across a wide range of conferences. The relatedness ranking of a conference is defined as its minimum rank with respect to the pivots. In order to turn the relatedness ranking into a rating, we will assume that there is a target bound on how many conferences can have a given rating which seems a reasonable assumption.
We now describe our conference rating technique based on the above ideas. The following notation is used:
- C is the set of all conferences;
- P is the chosen set of pivot conferences where P ⊂ C;
- Rp is a vector containing relatedness score of all conferences to pivot p by RW as described in Sec. 2, and R is a set of the vectors Rp given pivots P;
- Sp is a vector derived from Rp giving the rank to pivot p described below, and S is a set of the vectors Sp;
- L is a sorted list of rating labels from high to low, e.g. ‹ A, B, ... ›;
- and, Y is a vector giving the computed conference ratings.
We define Nlabel as the maximum number of conferences which should be rated as label or better. For example, NB = 100 means there should be at most 100 conferences which rated as A or B. Naturally, Nlabel is the total number of conferences when label is the lowest possible rating.
To simplify the description of the algorithm, we define another vector Sp which serves as a kind of inverted index of vector Rp. The value of Sp is its rank in a sorted version of Rp. Specifically, Spi = x if and only if Rpi is the x-th highest score in Rp. As there are a set of pivots P, then S denotes a set of Sp for each p ∈ P.
The classification algorithm is given in Algorithm 1 (CLASSIFY). The algorithms are presented for ease of explanation rather than the actual implementation. Starting from the highest to the lowest labels, we first find a threshold T for each label satisfying Nlabel, denoting the rank threshold for a conference to be labeled as label. It uses NConfRank defined as how many conferences across all pivots are the k-th closest to a pivot, making use of the set of vectors S, more specifically,
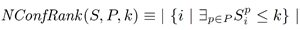
As NConfRank is monotonic on k, a specific implementation of Algorithm 1 can use binary search on S. This algorithm uses the simple assumption that a single common threshold suffices for all areas/pivots but it is possible to have more complex variants with varying thresholds. Once the thresholds are found for each label, the label of each conference can be determined using Algorithm 2 (GETRATING). Consider the threshold for the highest label which is also that of the pivots P, e.g. label A, all the conferences whose ranked distance based on the RW measure to some pivot in P which are less than the threshold are classified as label A. The next threshold is then used for conferences labeled as B and so on. In Algorithm 2, the notation minp{Spc} gives the least value of S for conference c with any pivot.
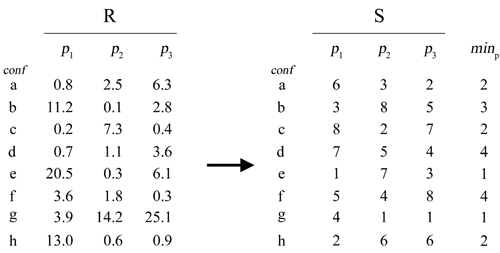
Figure 1: Example of mapping from Rp to Sp
Figure 1 shows an example mapping from Rp to Sp for 8 conferences and 3 pivots (recall that Spi contains the rank of Rpi in vector Rp). Suppose we want to classify the conferences in Figure 1 into a rating list ‹ A, B, C › with ‹ 3, 3, 2 › number of conferences respectively in each category. In other words, NA = 3, NB = 6, and NC = 8. Algorithm 1 will classify {e, g} as A, {a, b, c, h} as B, and {d, f} as C. The corresponding threshold T's are TA = 1 (i.e. conferences where the best rank is at most TA = 1 will be classified as A), TB = 3, and TC = 4.
5. Dataset
DBLP is a public and widely used computer science bibliographic database. We downloaded the DBLP XML data on 23 December 2013 and extracted entries which correspond to paper published in conferences.
DBLP does not contain any conference ratings. For conference ratings, we used two well known and widely used conference rating lists, CORE and CCF. The Computer Research and Education Association of Australasia (CORE) gives conferences ratings in 4 categories (A*, A, B, C) where A* is meant to be the most reputable while C be the least (note that this is different from CORE project). We encountered several issues when mapping the data from CORE to DBLP: (i) inconsistent conference naming; (ii) multiple entries for the same conference; and (iii) name-abbreviation mapping differences between CORE and DBLP. After some data cleanup, we obtained ratings for the conferences in DBLP which appear in CORE, which we call "DBLP data" (or simply DBLP when the context is clear).
We also employed the conference list from China Computer Federation (CCF) in our experiments. The CCF list is used heavily in China. This list contains considerably fewer conferences compared to CORE. Out of 309 conferences, we found 255 matched our DBLP data. CCF rates each conference into 3 categories (A, B, C). Note that the CCF and CORE ratings differ, though there are common points of agreement. Table 1 shows the rating distribution for CORE and CCF.
Table 1: CORE and CCF Rating Distribution
| Rating |
CORE |
CCF |
| A* |
61 |
— |
| A |
187 |
38 |
| B |
319 |
108 |
| C |
378 |
109 |
| Σ |
945 |
255 |
Microsoft Academic Search (Libra), which we will refer to as Libra, is an experimental search engine service developed by Microsoft Research for academic papers. We also experiment with the conferences found in Libra.
6. Experiments and Discussion
We experiment with how our RW classification algorithm compares with actual conference ratings from CORE and CCF. We do not expect that it can match perfectly, which would be rather surprising. Nevertheless, it would be interesting to see how our simple algorithm can perform.
As RW uses pivots, we selected the following 15 conferences which have A* rating in CORE as individual pivots
for the RW algorithm (these abbreviations follow DBLP):
POPL, ICSE, SIGMOD, ICML, KDD, CHI, SIGCOMM, SP, CRYPTO, SIGGRAPH, LICS, AAAI, STOC, ISCA, HUC
This choice was made manually but was intended to have broad coverage though may not be complete coverage. For example, POPL covers programming languages, ICSE for software engineering, SIGMOD for database, etc. The random walk length was set to be 4 following [4]. In order to make the result consistent and comparable between CORE and CCF, we have used the following settings for our classification algorithm:
- All A* conferences in CORE are mapped to A as CCF does not have A* rating. This gives the label list L = ‹ A, B, C ›.
- The target upper bounds for N are based on the number of such conferences in CORE, specifically, NA = 248, NB = 567, and NC = 945 (note that NB = 248 + 319).
Rating Differences between CORE and CCF
We first contrast the conference ratings in CORE and CCF. This is to illustrate that conference rating is inherently subjective and depend very much on how such lists are constructed. As far as we are aware, conference rating lists are usually manually constructed.
Given their manual construction, we should expect that the ratings will disagree on various conferences. In other words, we expect agreement for some conferences having common ratings and different ratings for others. We show this using a confusion matrix. Table 2 gives the confusion matrix between the ratings in CORE and CCF. Each row corresponds to the number of conference with such a rating in CORE, while each column corresponds to CCF's. For example, CORE and CCF agree on 37 conferences rated as A (or A* in CORE), however, there are 86 conferences rated A in CORE but rated B in CCF. From this table, we can see that CCF is more conservative compared to CORE; with the upper right triangle of the matrix having larger values. Note that perfect agreement in rating will result in all non-diagonal elements being zero in the confusion matrix.
Table 2: Confusion Matrix between CORE and CCF
| |
A |
B |
C |
Σ |
| A |
37 |
86 |
40 |
163 |
| B |
1 |
16 |
48 |
65 |
| C |
0 |
6 |
21 |
27 |
| Σ |
38 |
108 |
109 |
255 |
Classification based on RW
We see from comparing CORE with CCF, Table 2, that we should expect that there will be differences and non-zero elements in the non-diagonal elements when comparing two conference rating lists. We now experiment with our RW classification to see how it compares to these two well known rating lists.
Table 3 shows the confusion matrix between conference ratings in CORE and the result of our classification algorithm. Each row corresponds to CORE's and each column corresponds to ours. We can see there is strong positive correlation between our result and CORE with the diagonal entries being dominant. We note that this is stronger than when comparing CORE with CCF. Moreover, in the event of disagreement for the A and C classifications, most conferences are classified to the neighboring rating (A to B, or C to B). One could argue that the more significant difference in conference rating lies between A and C where B is intermediate and perhaps some A and B conferences might interchange labels, and similarly B and C might interchange. Furthermore, such conference ratings which are manually constructed have a subjective element while our algorithm is unbiased and deterministic.
Table 3: Confusion Matrix between CORE and RW
| |
A |
B |
C |
Σ |
| A |
157 |
66 |
25 |
248 |
| B |
60 |
150 |
109 |
319 |
| C |
26 |
108 |
244 |
378 |
| Σ |
243 |
324 |
378 |
945 |
We will examine some of the conferences which are classified differently by our algorithm, namely, AMCIS and CSB are rated A in CORE but classified as C by our algorithm. AMCIS is a conference in the area of Information Systems. One reason for those differences is because we have been conservative in the choice of pivots. In this case, we have not chosen a pivot which is in the area of Information Systems. The same also applies to CSB (a conference in the area of Bioinformatics) we have not used a pivot which is in Bioinformatics or Computational Biology. On the other hand, there are conferences which are rated C by CORE but classified as A by our algorithm. For instance, TAPSOFT is rated as C in CORE, but our algorithm classifies it as A because it shows a close relation to two of the pivots, i.e. POPL and LICS. We remark that TAPSOFT is rated as B in CCF and has evolved to the ETAPS joint conferences of which many are rated as A in CORE.
We also evaluated our result against the CCF ratings. In order to do this, we have retained the same classification result as in Table 3, selected those conferences appearing in CORE and CCF, i.e. the DBLP data which maps to both CORE and CCF, giving 255 conferences in total. Table 4 shows the confusion matrix. Similar to the CORE result, we also observed a positive correlation between CCF and our classification. Although there are disagreements between CORE and CCF, our algorithm still has a positive correlation to both.
Table 4: Confusion Matrix between CCF and RW
| |
A |
B |
C |
Σ |
| A |
22 |
13 |
3 |
38 |
| B |
6 |
68 |
34 |
108 |
| C |
2 |
30 |
77 |
109 |
| Σ |
30 |
111 |
114 |
255 |
We also experimented with the conferences in Libra, mapping the DBLP data to conferences in CORE and Libra. Libra does not have any conference ratings, thus, we only use it to select conferences from CORE. Table 5a shows the confusion matrix for the CORE conferences in Libra (CORE ∩ Libra) from DBLP data with our algorithm. Table 5b shows the confusion matrix for the remaining CORE conferences which are not in Table 5a. In both cases, we have used the labels classified from our algorithm running on CORE, i.e. the subset of conferences with labels from Table 3. Again, we observed positive correlation.
|
Table 5: Confusion Matrix for Libra
|
| |
A |
B |
C |
Σ |
| A |
123 |
54 |
17 |
194 |
| B |
46 |
117 |
82 |
245 |
| C |
20 |
78 |
166 |
264 |
| Σ |
189 |
249 |
265 |
703 |
|
 |
| |
A |
B |
C |
Σ |
| A |
30 |
18 |
6 |
64 |
| B |
13 |
29 |
32 |
74 |
| C |
8 |
29 |
77 |
114 |
| Σ |
51 |
76 |
115 |
242 |
|
|
(a) CORE ∩ Libra vs. RW
|
|
(a) CORE ∩ ¬Libra vs. RW
|
The preliminary experimental results show that a simple unbiased algorithm can give results with good correlation to existing conference rating lists. Clearly it would be impossible to get very high accuracy since such lists are usually manually constructed and thus is unlikely to be replicated by any algorithm. Still it is somewhat surprising that the RW classification gets good correlation with both CORE and CCF. We believe the results show that there is a good correlation between the social graph of authors in computer science with how authors publish in conferences. Our classification does depend on the pivot selection. We intend to experiment with more and varied pivots including automatic selection. We also intend to investigate variations which are less conservative than the conservative thresholds here.
Acknowledgements
This work has been supported by grant T1 251RES1207.
References
[1] C. Bird, E. Barr, A. Nash, P. Devanbu, V. Filkov, and Z. Su. (2009). "Structure and dynamics of research collaboration in computer science", International Conference on Data Mining (SDM '09). http://doi.org/10.1137/1.9781611972795.71
[2] E. Elmacioglu, D. Lee. (2005). "On six degrees of separation in DBLP-DB and more", ACM SIGMOD Conference. http://doi.org/10.1145/1083784.1083791
[3] M. Biryukov, C. Dong. (2010). "Analysis of computer science communities based on DBLP", 14th European conference on Research and advanced technology for digital libraries (ECDL '10). http://doi.org/10.1007/978-3-642-15464-5_24
[4] S. Effendy, I. Jahja, R. H. C. Yap. (2014). "Relatedness measures between conferences in computer science - a preliminary study based on DBLP", WWW Workshop on Big Scholarly Data: Towards the Web of Scholars. http://doi.org/10.1145/2567948.2579035
[5] M. Biryukov, C. Dong. Analysis of computer science communities based on DBLP. In ECDL, 2010.
About the Authors
 |
Irvan Jahja is a PhD student in the School of Computing at the National University of Singapore.
|
 |
Suhendry Effendy is a PhD student in the School of Computing at the National University of Singapore. His research is mainly in social networks.
|
 |
Roland H. C. Yap is an associate professor in the School of Computing at the National University of Singapore. His research interests are in artificial intelligence, constraints, programming languages, security and social networks.
|
|