D-Lib Magazine
July/August 1999
Volume 5 Number 7/8
ISSN 1082-9873
A Report on the PEAK Experiment
Usage and Economic Behavior
Jeffrey K. MacKie-Mason
School of Information
and Department of Economics
University of Michigan
[email protected]Juan F. Riveros
Department of Economics
University of Michigan
[email protected]Maria S. Bonn
University of Michigan Library
Digital Library Initiative
[email protected]Wendy P. Lougee
University of Michigan Library
Digital Library Initiative
[email protected]
1. Introduction
Electronic access to scholarly journals has become an important and commonly accepted tool for researchers. The user community has become more familiar with the medium over time and has started to actively bid for alternative forms of access. Technological improvements in the communication networks, paired with the decreasing costs of hardware, create greater incentives for innovation. Consequently, although publishers and libraries face a number of challenges, they also have promising new opportunities.1 Publishers are creating many new electronic-only journals on the Internet, while also developing and deploying electronic access to literature traditionally distributed on paper. They are modifying traditional pricing schemes and content bundles, and creating new schemes to take advantage of the characteristics of digital duplication and distribution.
The University of Michigan has operated a field trial in electronic access pricing and bundling called "Pricing Electronic Access to Knowledge" (PEAK).2 We are providing a host service consisting of roughly three and a half years of content (January 1995 -- June 1999) of approximately 1200 Elsevier Science scholarly journals. Participating institutions have had access to this content for over 18 months, after which the project ends and access through our system ceases. Michigan provides Internet-based delivery to over 340,000 authorized users at twelve campuses and commercial research facilities across the U.S. The full content of the 1200 journals is received, catalogued, indexed and delivered in real time. Our research team has been investigating the effects of product bundling and pricing structures for electronic access In this article we, report some preliminary results.
2. The problem
Information goods such as electronic journals have two defining characteristics. The first and most important is low marginal (incremental) cost. Once the content is transformed into a digital format, the information can be repackaged and distributed at almost zero cost. Nevertheless, information goods often involve high fixed ("first copy") costs of production. A production facility and distribution server must be in place in order to take advantage of the low costs of distribution. For a typical scholarly journal, most of the cost to be recovered by the producer is fixed.3 The same is true for both publisher and distributor in an electronic access environment. With the cost of electronic "printing and postage" essentially zero, nearly all of the cost of distribution consists of the system costs due to hardware, administration, and database creation and maintenance -- all costs that must be incurred whether there are two or two million users. Our experience with PEAK bears this out: the only significant variable operating cost is the service of the user support team who answer questions from individual users. This has been a small part of the total cost of providing the PEAK service.
Electronic access offers new opportunities to create and extract value from scholarly literature. This additional value can benefit readers, libraries, distributors and publishers. For distributors and publishers, additional value can help to recover the high fixed costs. Increased value can be created through the production of new products and services (such as early notification services and bibliographic hyperlinking). Additional value that already exists in current content can also be delivered to users and, in part, extracted by publishers through new product bundling and nonlinear pricing schemes that become possible with electronic distribution. For example, journal content can be unbundled and then rebundled in many different ways. Bundling enables the generation of additional value from existing content by targeting a variety of product packages to customers who value the existing content differently. For example, most four-year colleges subscribe to only a small fraction of Elsevier titles. With innovative electronic bundling options, content now can be accessible to which, previously, this population had little access.
The underlying economic motivation for the PEAK experiment is to learn how additional value can be extracted from existing content by means of innovative electronic product offerings and pricing schemes such as bundling. Over the next year, we would like to determine how users respond to different pricing schemes and would like to assess the additional value created from new forms of bundling. We will analyze the impact of the different pricing schemes on publisher revenues. We will compare our empirical evidence with the predictions from the economic literature on bundling of information goods. In this article, we present some of preliminary summaries of usage and economic behavior, based on the first year and four months of data.
3. Access models offered
Participants in the PEAK experiment were offered packages containing two or more of the following three access products:
- Traditional subscription. Unlimited access to the material available in the corresponding print journal.
- Generalized subscription. Unlimited access to any 120 articles from the entire database of priced content, typically the two most current years. Articles are selected for this user-defined subscription on demand, after they are published, as users request articles that are not otherwise already paid for, until the subscription is exhausted.4 Articles selected for institutional generalized subscriptions may be accessed by all authorized users at that institution.
- Per article. Unlimited access for a single individual to a specific article. If an article is not available in a subscribed journal, nor in a generalized subscription, nor are there unused generalized subscription tokens, then an individual may purchase access to the article for personal use.
For more information about the product offerings, see our companion article (Bonn et al., 1999).
The per article and generalized subscription options allow users to capture value from the entire corpus of articles, without having to subscribe to all of the journal titles. Once the content is created and added to the server database, the incremental cost of delivery is approximately zero. Therefore, to create maximal value from the content, it is important that as many users as possible have access. The design of the price and bundling schemes affect both how much value is delivered from the content (the number of readers), and how that value is shared between the users and the publisher.
Institutional generalized subscriptions may be thought of as a way to pre-pay (at a discount) for interlibrary loan requests. One advantage of generalized subscription purchases for both libraries and individuals is that the "tokens" cost substantially less per article than the per-article license price. By predicting in advance how many tokens will be used (and thus bearing some risk), the library can essentially pre-pay for interlibrary loans, at a reduced rate. However, unlike an interlibrary loan, all users within the community have ongoing unlimited access to the articles that were obtained with generalized subscription tokens. One advantage to a publisher is that they represent a committed flow of revenue at the beginning of each year, and thus shift some of the risk for usage (and revenue) variation on to the users. Another is that they open up access to the entire body of content to all users, and by thus increasing user value from the content, provide an opportunity to obtain greater returns from the publication of that content.
Participating institutions in the experiment were assigned randomly to one of three different experimental treatments, which we labeled as the Red, Green and Blue groups. Users in every group could purchase articles on a per article basis; in the Green group they could also purchase institutional generalized subscriptions; in the Blue Group they could purchase traditional subscriptions; in the Red group they could purchase all three types of access.5. Twelve institutions are participating in PEAK: large research universities (including the University of Michigan), medium and small colleges and professional schools, and corporate libraries.
4. Pricing
Pricing electronic access to scholarly information is far from being a well-understood practice. Based on a survey of 37 publishers, Prior (1999) reported that when both print-on-paper and electronic versions were offered, 62% of the publishers have had a single combined price, with a surcharge over the paper subscription price of between 8% and 65%. The most common surcharge is between 15-20%. Half of the respondents offer electronic access separately at a price between 65% and 150% of print, most commonly between 90% and 100%. Fully 30% of the participating publishers have changed their pricing policy just this year. In this section we will describe the pricing structure chosen in the PEAK experiment and the rationale behind it.
For content that can be delivered either on paper or electronically, there are three primary cost categories: content cost, paper delivery cost and electronic delivery costs. The price levels chosen for the experiment reflect the components of cost, adjusted downward for an overall discount to encourage participation in the experiment.
The relative prices between access options were constrained by arbitrage possibilities that arise because users can choose different options to replicate the same access. In particular, the price per article in a per-article purchase had to be greater than the price per article in a generalized subscription, and this price had to be greater than the price per article in a traditional subscription. These inequalities impose the restriction that the user cannot save by trying to replicate a traditional subscription by subscribing to individual articles or a generalized subscription, or save by replicating a generalized subscription by paying for individual articles. Alternatively, this means that the producer will never charge a price for the bundle greater than the sum of the prices of the individual components.
To participate in the project, each institution paid the University of Michigan an individually negotiated institutional participation license fee (IPL), roughly proportional to the number of authorized users. In addition, the access prices for articles were:
- Traditional Subscription
. The library pays an annual fee per traditional subscription. The fee depends on whether the library previously subscribed to the paper version of the journal, as follows:
- If the institution previously subscribed to a paper version of the journal, the cost of the traditional subscription is $4 per issue6 regardless of journal title. Since the content component is already paid, the customer is only charged for an incremental electronic delivery cost.7
- If the institution was not previously subscribed to the paper version, the cost of the traditional subscription is $4 per issue, plus 10% of the paper version subscription price. In this case, the customer is charged for the electronic delivery cost plus a percentage of the content charge.
- Generalized Subscription. A library pays $548 for access rights to 120 articles ($4.56 per article). These articles are selected on demand, after publication. A library may purchase any number of generalized subscriptions it wishes, but all generalized subscriptions must be purchased within the first 60 days after the start of the billing year. Once accessed, articles may be used any number of times by all members of the institution, for the life of the project.
- Per-article licensing. A library or individual may pay for access to individual articles. The per-article fee is $7 per article.8 Once licensed, an article may be used any number of times by the individual licensor for the life of the project. Most electronic delivery services charge per use, not per article.
The mapping of costs to prices is not exact, and because there are several components of cost, the relationship is complicated. For example, although electronic delivery costs are essentially zero, there is some incremental cost to creating the electronic versions of the content (especially under Elsevier's current production process which is not fully unified for print and electronic publication). This electronic publication cost is the justification for the $4 per issue price for electronic delivery of traditional subscriptions.
5. Revenues and costs
In Table 1 we summarize the revenues received to date by PEAK. The total revenue has been over $440,000.9 The first and third rows report the annual revenues, with 1999 adjusted to reflect an estimate of what revenues would have been if the service were to run for the full year (it ends in August 1999, but only six months of content are included, and prices were adjusted accordingly).10 We can see that between the first and second year of the service, the number of traditional subscriptions was substantially decreased: this occurred because two schools cancelled all of their (electronic) subscriptions. By reducing the number of journal titles under traditional subscription, the users of these libraries needed to rely more heavily on the availability of unused generalized subscription tokens, or they had to pay the per article fee. We see from the table that the annualized revenues for per article purchasing are more than ten times higher in 1999 than in 1998, and that the 1999 generalized subscription revenues (annualized) are 22% higher than in 1998. Therefore, at this gross level of aggregation, we see evidence that as they gained experience with PEAK, librarians favored the more flexible access options (generalized subscription and per article) that allow users to select the articles they want to read from the entire corpus at a constant cost.
Table 1. Revenues
Year
Trad'l Subs
Revenue: Trad'l
Gen'l Subs
Revenue: Gen'l
Articles purchased
Revenue: Articles
Revenue: All Access
IPL
Total Revenue
1997-98
1949
$216018
151
$82748
275
$1925
$300691
$140000
$440,691
1999*
1277
$33608
92
$50416
1896
$13272
$97296
$42000
$139,296
Annualized 1999 **
1277
$78996
184
$100832
3792
$26544
$206372
$84000
$290,372
Total Annualized 1997-1999
3226
$295014
335
$183580
4067
$28469
$507063
$224000
$731,063
* Article Subscription use up to May 1999
** Assumes twice the quantity of Generalized Subscriptions and per article purchases. Traditional subscriptions priced at the full year rate.
A full calculation of the costs of supporting the PEAK service is difficult, given the mix and dynamic nature of costs (e.g., hardware). We estimate expenditures reached nearly $400,000 during the 18 month life of the project. Of this cost, roughly 35% was expended on technical infrastructure and 55% on staff support (i.e., system development and maintenance, data loading, user support, authentication/authorization/security, project management). Participant institution fees covered approximately 45% of the project costs, with vendor and campus in-kind contributions covering another 20-25%. UM Digital Library Production Service resources were also devoted to this effort, reflecting the University of Michigan's contribution to providing this service to its community and also its interests in supporting the research.
In the following two sections, we present preliminary results on the usage of the PEAK service. We summarize some demographics of the user community, and then analyze usage and economic behavior.
6. User demographics
In the PEAK project design, unmetered articles and articles covered by traditional subscriptions could be accessed by any user from a workstation associated with one of the participating sites (authenticated by the computers IP address). If users wanted to use generalized subscription tokens, to purchase individual articles on a per-article basis, they had to obtain a password and use it to authenticate.11 We have more complete data on the smaller number of users who obtained and used passwords.
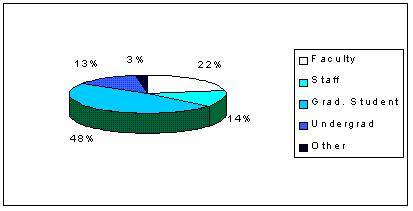
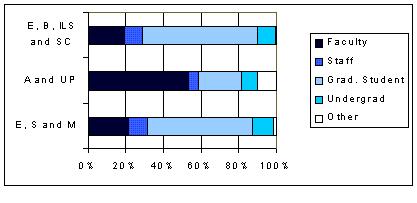
In Table 2 we report the distribution of the more than three thousand users who obtained passwords and who used PEAK at least once. Most of the users are from engineering, science and medicine, reflecting the strength of the Elsevier collection in these disciplines. 70 % of these users were either faculty or graduate students (see Figure 1). The relative fractions of faculty and graduate students varies widely by discipline (see Figure 2). Our sample of password-authenticated users is probably not representative of all electronic access usage, but it represents an important group of users who are more motivated (and the sample includes all of those who accessed articles via either generalized subscription tokens or by per article purchase).
Table 2. Users with passwords with authenticated accesses to the PEAK system
Status
Division
Faculty
Staff
Grad. Student
Undergrad
Other
Total
Engineering, science and medicine
353
171
918
182
33
1657
Architecture and urban planning
101
10
43
16
19
189
Education, business, information/library science and social science
82
41
263
42
1
429
Other
157
208
311
168
28
872
Total
693
430
1535
408
81
3147
Figure 1. Percentage of users with passwords by status
Figure 2. Users with passwords who accessed PEAK
7. Access and economic behavior
In Table 3 we summarize usage of PEAK through May 1999. There have been 270,236 different accesses to the PEAK system over 17 months (in fact, the full number of authorized users joined the system gradually over the first nine months of 1998). Of these, 63% were accesses of "unmetered" material (not-full-length articles, plus all content published pre-1997 during 1998, and all pre-1998 content during 1999).12 However, one should not leap to the conclusion that users will access scholarly material much less when they have to pay for it, though surely that is true to some degree. First, to users much of the "metered" content appeared to be free: the libraries paid for the traditional subscriptions and the generalized subscription tokens. Second, the quantity of "unmetered" content in PEAK was substantial: on day one, approximately January 1, 1998, all 1996 content and some 1997 content was in this category. On January 1, 1999, all 1996 and 1997 content and some 1998 content was in this category.
Generalized subscription "tokens" were used to purchase access to 16,176 articles ("1st token"). These articles were then accessed an additional 26,231 times ("2nd or higher tokens"), for an average of 2.6 accesses per generalized subscription article. A total of 2171 articles were purchased individually on a per article basis; these were accessed 1.4 times per article on average. The difference in the number of accesses per article for articles obtained by generalized subscription and by per-article purchase is likely due to the difference in who may access the article after initial purchase. All authorized users at a site can access an article once it has been purchased with a generalized subscription token, while only the individual making a per-article purchase has the ability to re-access that article. Thus, we can estimate that initial individual readers accessed individually paid (by token or per-article purchase) for articles 1.4 times, and additional system users accessed these articles 1.2 times. It appears on average there is at least one additional user per article under the more lenient access provisions of a generalized subscription token.
Table 3. Total number of accesses by group and type of access: Jan 1998 - May 1999
Model/ Type of Access
Unmetered
Traditional
1st use of generalized subscription articles
2nd or higher use of generalized subscription articles
1st use of per-article purchased articles
2nd or higher use of per-article purchased articles
Total number of accesses
Green
39097
N/A
7574
12216
122
223
59232
Red
117638
50088
8602
14015
7
4
190354
Blue
14583
3294
N/A
N/A
2042
731
20650
All Groups
171318
53382
16176
26231
2171
958
270236
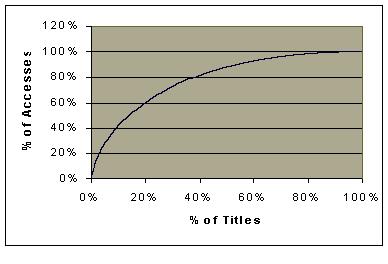
In Figure 3 we show a curve that reveals the concentration of usage among a relatively small number of Elsevier titles. We sorted articles that were accessed from high to low in terms of how often they were accessed. Then we found out what the smallest number of articles was that together comprised a given percentage of total accesses, and counted the number of journal titles from which these articles were drawn. For example, it only required 37% of the 1200 Elsevier titles to generate 80% of the total accesses. 40% of the total accesses were accounted for by only about 10% of the journal titles.
Figure 3. Concentration of accesses
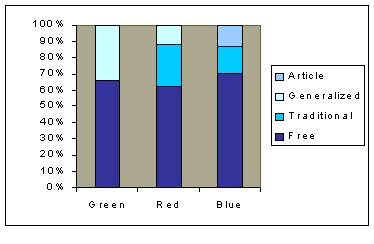
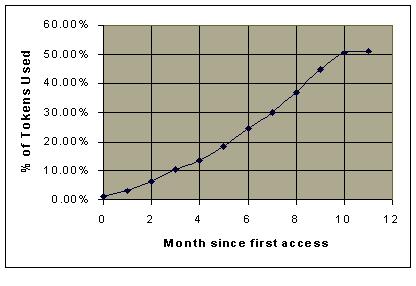
In Figure 4 we compare the fraction of accesses within each group of institutions that are accounted for by traditional subscriptions, generalized subscriptions and per-article purchases. Of course, the Green and Blue groups only had two of the three access options. We observe that when institutions had the choice of purchasing generalized subscription tokens, their users purchased essentially no access on a per-article basis. Of course, this makes sense as long as tokens are available: it costs the users nothing to use a token, but it costs real money to purchase on a per-article basis. What the data also indicate is that institutions that could purchase generalized subscription tokens tended to purchase more than enough to cover all of the demand for articles by their users; i.e., they didn't run out of tokens.13 We show this in aggregate in Figure 5: only about 50% of the tokens purchased for 1998 were in fact used. (Nonetheless, institutions purchased more generalized subscriptions on an annualized basis in 1999 than in 1998; see Table 2. Revenues.)
Figure 4. Percentage of model used by group: Jan 1998 - May 1999
Articles in the "unmetered" category constituted about 65% of use across all three groups, regardless of which combination or quantity of traditional and generalized subscriptions an institution purchased. The remaining 35% of use was paid for with a different mix of options depending on the choices available to the institution. Evidently, none of the options "throttled" use.
Figure 5. Percentage of pre-paid tokens used: 1998
We show the total number of accesses per potential user in Figure 6. We divide by potential users (the number of people authorized to use the computer network at each of the participating institutions) because different institutions joined the experiment at different times. This figure thus gives us an estimate of learning and seasonality effects in usage. Usage per potential user was relatively low and stable for the first 9 months. However, it then increased to a level nearly three times as high over the next 8 months. We expect that this increase was due to more users learning about the existence of PEAK and becoming accustomed to using it. Note also that the growth begins in September, 1998 (month 9), the beginning of a new school year with a natural bulge in demand for scholarly articles. We also see pronounced seasonal effects in usage: local peaks in March, November and April (months 3, 11 and 16). (The drop in April 1998 is a puzzle to us.) To see the learning effect without interference from the seasonal effect, we calculated usage by type of access in the same three months (March-May) of 1998 and 1999; see Table 4. Overall, usage increased 167% from the first year to the second.
Figure 6. Total accesses per potential user: Jan 98 - May 99
Table 4. Learning: Two-year comparison (Mar - May)
Year
Unmetered
Traditional
1st Token
1st per article purchase
2nd or higher Token
2nd or higher per article purchase
Total
1997-98 (Mar-May)
19291
6374
1648
1
3060
8
30382
1999 (Mar-May)
55745
10560
4805
1288
8166
472
81036
Percentage Change
189%
66%
192%
n/a
167%
5800%
167%
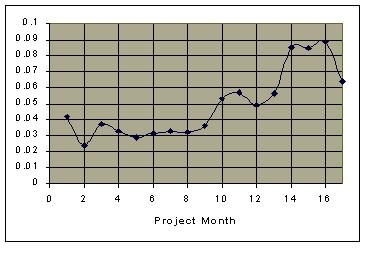
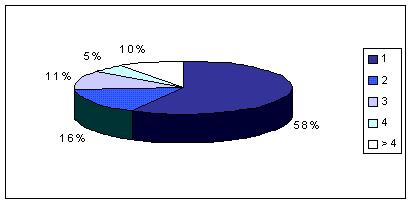
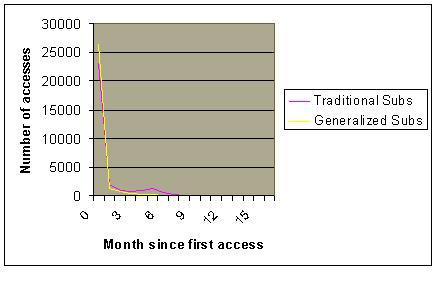
We considered the pattern of repeat accesses distributed over time. In Figure 7 we show that about three-fourths of articles accessed were accessed no more than two times. To study repeat accesses, we selected only those articles (26%) that were accessed three or more times between January 1998 and May 1999 ("high use articles"). We then counted the number of times they were used in the first month since the initial access, the second month since, and so forth; see Figure 8. What we see is that almost all access to even "high use" articles occurred during the first month. In the second and later months, there was a very low rate of use that persisted for about 7 more months, then faded out altogether. Thus, we see that, even among the most popular articles, recency was very important.
Figure 7. Percentage of articles by number of times read
Figure 8. Monthly accesses for high-use articles (3 or more accesses)
Although recency appears to be quite important, we saw in Table 1 that over 60% of accesses altogether were for content in the "unmetered" category, most of which was over one year old. Although we pointed out that the monetary price to users for most "non-unmetered" articles was still zero (if accessed via institution-paid traditional or generalized subscriptions), there are still higher user costs for much of the more recent usage. If a user wants to access an article using a generalized subscription token, then she must get a password, remember it (or where she put it) and use it. If the article is not available in a traditional subscription and no tokens are available, then she must do the above plus pay for the article with hard currency. Therefore, there are real user cost differences between the "unmetered" and "metered" content, and the fact that usage of the older, "unmetered" content is so high, despite the clear preference for recency, supports the notion that users respond strongly to costs of accessing scholarly articles.14
8. Conclusions
It is too early to draw firm conclusions from the PEAK research project: we are continuing to collect data through August 1999, and have only completed preliminary analysis of the data currently available. However, we have observed several interesting features of user behavior and the economics of access to scholarly literature:
- The innovative access model we introduced -- the generalized subscription -- is only feasible in an electronic environment and, apparently, was quite successful. Users at all institutions, even the largest, gained easy and fast access to a much larger body of content than they previously had from print subscriptions, and they made substantial use of this opportunity.
- The user cost of access, consisting of both monetary payments and time or effort, has a significant effect on the number of articles that readers access.
- There is a substantial learning curve during which users become aware of the service and accustomed to using it. It appears that usage was increasing even after a year of service. By the end of the experiment, usage was at a rather high level: approximately one article accessed per month per 10 potential users, with potential users defined broadly (including all undergraduate students, who rarely use scholarly articles directly).
- It has long been known that overall readership of scholarly literature is low. We have seen that even the most popular articles are read only a few times, across 12 institutions. Of course, we could not simultaneously measure how often those articles were being read in print versions.
- Recency is very important: repeat usage dropped off considerably after the first month. (This was also reflected in user comments, not reported above.)
We will undertake more careful analyses of the data over the next year. At the moment, we think the most important finding is that access can be expanded through innovative schemes like the generalized subscription while maintaining a predictable flow of revenue to the publisher.
9. Notes
[Note 1] See MacKie-Mason and Riveros (1999) for a discussion of the economics of electronic publishing.
[Note 2] See the earlier companion to this article for a more detailed description of the PEAK service (Bonn et al., 1999).
[Note 3] Odlyzko (1995) estimates that it costs between $900-$8700 to produce a single math article. 70% of the cost is editorial and production, 30% is reproduction and distribution.
[Note 4] 120 is the approximate average number of articles in a traditional printed journal for a given year. We refer to this bundle of options to access articles as a set of tokens, with one token used up for each article added to the generalized subscription during the year.
[Note 5] We have just started to analyze the data, which we are still collecting, and have not yet studied most of the interesting behavioral differences between users in the different groups.
[Note 6] An "issue" is identical to a print issue. A subscription year is referred to as a volume; generally, most journals have 4 to 12, or more, issues per year. The actual prices were adjusted to reflect more than a full year of content during the first project year, and less than a year of content the second project year.
[Note 7] The institution must continue to subscribe to the paper version. If a library cancelled a paper subscription during the life of PEAK, it was required to pay the full paper cost plus 10% for the electronic subscription, to make it uneconomical to use electronic subscriptions to replace previously subscribed paper subscriptions. This was not intended to represent future pricing schemes, but to protect Elsevier's subscription base since the PEAK prices were deeply discounted.
[Note 8] The per-article fee is the same whether paid by a library on behalf of an individual, or paid by the individual directly.
[Note 9] The University of Michigan received $182,000 in IPL fees for providing the service. The remainder, net of payment processing costs, was received by Elsevier Science for the value of accessing the content.
[Note 10] Due to delays in starting the project, the first revenue period covered content from both 1997-98, although access was available only during 1998. For this period, prices for traditional subscriptions were set to equal $6/issue, or 1.5 times the annual price of $4/issue, to adjust for the greater content availability.
[Note 11] Through an onscreen message we encouraged all users to obtain a password and use it every time in order to provide better data for the researchers. Only a small fraction apparently chose to obtain passwords based solely on our urging; most apparently obtained passwords because they were necessary to access a specific article.
[Note 12] A substantial amount of material, including all content available that was published two calendar years prior, was available freely without any additional charge after an institution paid the IPL fee to join the service. We refer to this as "unmetered". Full-length articles from the current two calendar years were "metered": users could access it only if the articles were paid for under a traditional or generalized subscription, or purchased on a per article basis.
[Note 13] Of course, the 1999 portion of the experiment continues for three months after the data, so more institutions may run out of tokens before the trial is complete.
[Note 14] In another preliminary test of the impact of user cost on usage, we compared the usage of the Red and Blue groups. Red institutions had both generalized and traditional subscriptions available; Blue had only traditional. We calculated the number of "paid" articles accessed (paid by generalized tokens or per article) for each group, after normalizing by the number of traditional subscriptions, and the number of potential users at the institutions. We found that when generalized subscriptions were available, which have a much lower user cost since the library pays for the tokens, three times as many articles were accessed as at institutions which had to pay for each of these articles on a per article basis. We will present the details of this and further analyses in future articles.
10. References
Bonn, Maria, Wendy Lougee, Jeffrey K. MacKie-Mason and Juan Riveros (1999). "A Report on the PEAK Experiment: Context and Design," D-lib Magazine 5, no. 6, June. < http://www.dlib.org/dlib/june99/06bonn.html >.
King, D.W. and J.M. Griffiths (1995). "Economic issues concerning electronic publishing and distribution of scholarly articles," Library Trends 43, no. 4, 713-740.
MacKie-Mason, Jeffrey K. and Juan F. Riveros (1999). "Economics and Electronic Access to Scholarly Information, in The Economics of Digital Information (tentative title), D. Hurley, B. Kahin and H. Varian, eds. (MIT Press, forthcoming). < http://www-personal.umich.edu/~jmm/papers/peak-harvard97/ >.
Prior, Albert (1999). "Electronic journals pricing -- still in the melting pot?" UK Serials Group 22nd Annual Conference / 4th European Serials Conference, 12-14 April, UMIST, Manchester, England.
Odlyzko, Andrew (1995). "Tragic Loss or Good Riddance? The impending demise of Traditional Scholarly Journals", International Journal of Human-Computer Studies, 42: 71-122.
Copyright © 1999 Jeffrey K. MacKie-Mason, Juan F. Riveros, Maria S. Bonn, and Wendy P. Lougee
Top | Contents
Search | Author Index | Title Index | Monthly Issues
Previous story | Clips & Pointers
Home | E-mail the EditorD-Lib Magazine Access Terms and Conditions
DOI: 10.1045/july99-mackie-mason