|
|
|
| P R I N T E R - F R I E N D L Y F O R M A T | Return to Article |
D-Lib Magazine
November/December 2014
Volume 20, Number 11/12
A Comparison of Two Unsupervised Table Recognition Methods from Digital Scientific Articles
Stefan Klampfl
Know-Center GmbH, Graz, Austria
sklampfl@know-center.at
Kris Jack
Mendeley Ltd., London, UK
kris.jack@mendeley.com
Roman Kern
Knowledge Technologies Institute, Graz University of Technology, Graz, Austria
rkern@tugraz.at
doi:10.1045/november14-klampfl
Abstract
In digital scientific articles tables are a common form of presenting information in a structured way. However, the large variability of table layouts and the lack of structural information in digital document formats pose significant challenges for information retrieval and related tasks. In this paper we present two table recognition methods based on unsupervised learning techniques and heuristics which automatically detect both the location and the structure of tables within a article stored as PDF. For both algorithms the table region detection first identifies the bounding boxes of individual tables from a set of labelled text blocks. In the second step, two different tabular structure detection methods extract a rectangular grid of table cells from the set of words contained in these table regions. We evaluate each stage of the algorithms separately and compare performance values on two data sets from different domains. We find that the table recognition performance is in line with state-of-the-art commercial systems and generalises to the non-scientific domain.
Keywords: Table Recognition, Document Analysis, Unsupervised Learning, PDF Extraction, Text Mining
1. Introduction
Tables and tabular structures are found in many digital articles. Tables allow the authors to present information in a structured manner and to communicate and summarise key results and main facts. It allows readers to get a quick overview of the presented information, to compare items and put them into context. Tables are also in the focus of attention of those who analyse and process digital articles for data mining, information retrieval, and other tasks related to digital libraries and supporting infrastructures. Here the motivation to extract information out of tables is based on two assumptions: i) tables are expected to be more lenient to be automatically extracted, especially in contrast to analysing the written natural language text, and ii) tables are expected to often contain factual information making them especially suitable for further processing and aggregation. In this paper we focus on the first assumption and attempt to give an answer on the difficulty of the task of automatically extracting tables out of digital articles.
Digital documents come in many forms and formats. In this work we deliberately restrict ourselves on a single domain and a singe file format. We have chosen a domain which we consider to be knowledgeable of, which is the domain of digital scientific articles, often referred to as publications or papers. In terms of file format we focus on the de-facto standard for the exchange and distribution of digital scientific articles, which is the Portable Document Format (PDF), a file format which is accompanied by an official standard.
In order to conduct the table extraction task, there are a number of initial steps involved as preparation and preprocessing steps: Given a digital scientific article as PDF, it first needs to be parsed. The output of this step is comprised of all characters on a single page together with position information and some font and formatting information. Next, the parsed information is analysed to infer layout information of the pages. Then the actual table regions need to be detected. The domain of scientific articles here allows the use of additional clues, for example most of the tables are adorned with a caption, which is for the most part consistently labelled. Once the bounding box of a table has been identified, the main task of the table extraction can start. The final output is a structure of the tables reconstructed from its layout together with the content of the table.
The restriction on the domain of scientific articles does help in identifying the table region due to the consistency of the table captions imposed by the layout guidelines given out by journals and conferences and the generally high adherence of authors of scientific publications to these guidelines. Apart from this aspect, the finding of this work should not be limited to the scope of the scientific publication domain, i.e., the actual table extraction process itself is not bound by the domain. The same goes for the file format, where the presented approach will work as long as layout information is available, which can in principle be even induced from ASCII tables. In particular, our approaches will still be operational even if no additional hints are available, for instance the presence of horizontal or vertical lines to separate the rows or columns.
The remainder of this work is structured as follows: In section 2 we present existing and related approaches for the task of table extraction. Section 3 gives a detailed description of the algorithms and the individual steps of the table region detection and table extraction approaches. The next section section describes the used data sets and our evaluation methodology together with the achieved results. In section 4 we analyse and interpret the findings and discuss the results. Finally, section 5 concludes and summarises the main results and gives an outlook on future work.
2. Related Work
Up to now, several computational approaches have been applied to recover tables from documents with various encodings, see, e.g., [13, 20] for reviews. Before the advent of born-digital documents early methods focused on recognizing tables from ASCII text or scanned document images. Each table recognition method uses a particular definition of the location and the composition of a table, a so-called table model. Table models can be distinguished into structural and conceptual table models [4]. In contrast to structural table models defining the region and the cell structure of a table, conceptual table models abstract content from presentation. The most notable and well-known conceptual table model was proposed by Wang [18] and later extended by Hurst [9]. This model divides a table into different semantic regions such as row or column headers. In this paper we only consider a structural table model and use the common distinction of table recognition into two steps, table detection and table structure recognition [8].
A detailed list of existing table recognition methods can be found in [20]; here we restrict our discussion on a number of more recent approaches that attempt to discover tables from PDF documents. One of the first efforts is the pdf2table system [19]. It uses heuristics to detect both the table region and the table structure. Text is merged to single- or multi-lines, depending on the number of contained text segments. Following the hypothesis that a table must have more than one column, a table region is formed by merging neighbouring multi-lines. The resulting table region is then decomposed into the tabular structure by creating columns based on the boundaries of text elements. However, the application of this approach is restricted to single-column page layouts.
The approach in [12] describes a table detection method that uses heuristics to construct lines from individual characters and to label sparse lines. Supervised classification is used to select those sparse lines that occur within a table. Starting from a table caption, these sparse lines are then iteratively merged to a table region. This approach is very similar to ours, except that our algorithm builds upon labelled text blocks instead of lines.
The PDF-TREX system [16] starts from the set of words as basic content elements and identifies tables in a bottom-up manner. First, words are aligned and grouped to lines based on their vertical overlap, and line segments are obtained using hierarchical agglomerative clustering of words. According to the number of segments a line is classified into three classes: text lines, table lines, and unknown lines. Then, the table region is found by combining contiguous table lines or unknown lines. The table structure is extracted as a 2-dimensional grid with columns and rows obtained via clustering and heuristics based on their horizontal and vertical vertical overlap.
In one of our algorithms for table structure recognition we also employ hierarchical agglomerative clustering to merge words to columns and rows. Similar clustering approaches have been carried out for ASCII text [10, 7]. Zuyev [21] presents a method based on analysing projection histograms, which is related to our second approach. It also uses k-means clustering (k=2) to separate those minima corresponding to column boundaries from other, spurious minima. Other approaches look for ruling lines and other visual cues [6, 2]. The recent ICDAR 2013 Table Competition [5] benchmarked a number of further techniques. The winner was a very sophisticated system that has been developed as a master's thesis [15]. It combines raster image processing techniques, e.g., edge detection, with heuristics on object-based text information in a series of processing steps.
3. Algorithms
The starting point of our table extraction algorithm is a set of contiguous text blocks extracted from the PDF file. These text blocks are obtained via previously developed algorithms [11] that build upon the output of the open source PDFBox library. The table extraction itself consists of two parts, the detection of the table region and the extraction of the tabular structure inside the table region. We present two different approaches for the latter part that make use of unsupervised machine learning techniques. One is based on merging words inside the table region to rows and columns, the other one is based on partitioning the table contents into rows and columns based on analysing vertical and horizontal projection histograms.
3.1 Detecting the table region
The table region detection aims at collecting those text blocks that belong to a table. This collection of blocks is later used as input to the next step, the extraction of the tabular structure. Our table region detection is similar to the algorithm presented in [12], but adapted to contiguous text blocks instead of lines. The idea is to look for table captions and then recursively merge neighbouring "sparse" blocks to the growing table.
We reused the algorithms for detecting caption blocks and sparse blocks, as well as the concept of the neighbourhood between blocks from our previous work [11]. To identify table captions we look for blocks where the first word equals one of certain predefined keywords (viz., "Table", "Tab", "Tab.") and the second word contains a number (optionally followed by a punctuation, such as ":" or "."). This simple caption detection method has been used in previous work [12, 3]. According to [12] we label blocks as sparse blocks if (1) their width is smaller than 2/3 of the average width of a text block, or (2) there exists a gap between two consecutive words in the block that is larger than than two times the average width between two words in the document. The block neighbourhood is calculated by a simple straightforward algorithm that searches for the nearest neighbour of each block on the page in each of the four main directions, viz., top, bottom, left, and right.
In addition, we incorporate information about the columns of the document provided by our previously developed main text extraction [11]. These columns should obviously provide additional hints to the table region detection, since some tables might completely reside within one column. In particular, we recognize tables as such single column tables beforehand, if their caption block is either left or centre aligned within a column and consists of at least one natural line break.
Starting from a table caption we first look for the closest sparse block on the page that has a horizontal overlap with the caption block. This block is included as the first block into the resulting table region. We then put all its neighbouring blocks into a first-in-first-out queue that manages the set of blocks still to be checked. For each block in the queue we check if it should also be included into the table, and if yes, we put its neighbours into the queue.
A block is included into the table if each of the following conditions is met:
- the block is sparse,
- the vertical distance of the block to the current table region is less than 2.5 times the average line height of the document,
- if the current table region so far lies completely within a column, the block (at least) overlaps this column,
- if the table has been recognized as a single column table, the block lies completely inside this column,
- the block has a valid positioning with respect to the caption block. Since captions are usually centre- or left-aligned to the table, we do not include blocks that are too much to the left of the caption. More precisely, we include only blocks whose left x-coordinate is closer to the centre x-coordinate of the caption block than the right border of the page.
We proceed until the queue is empty, and all text blocks that we have collected make up the resulting table region. Examples of detected table regions are shown in Figure 1.
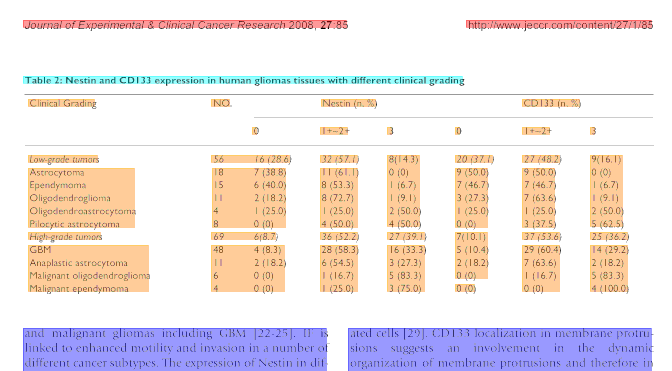
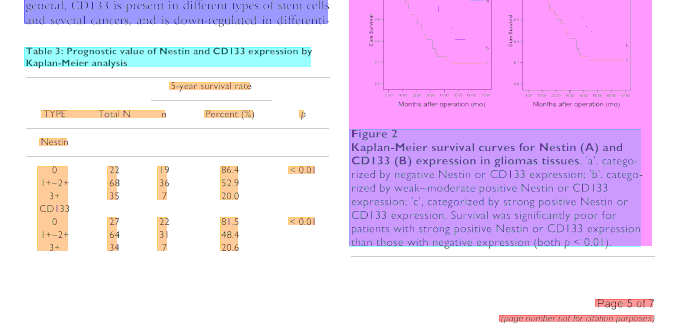
Figure 1: Two snapshots of detected table regions from a scientific article in PDF format. The extracted text blocks are shown as coloured rectangles. Starting from a caption block (cyan) neighbouring sparse blocks are recursively merged to the table region (orange).
3.2 Extracting the tabular structure
The next step extracts the tabular structure from a table region consisting of a set of text blocks collected in the previous step. Here, we move to a finer granularity by considering words instead of text blocks. The result is basically a rectangular grid of table cells, each of which contains a set of words and which potentially spans multiple rows or columns.
We implemented two approaches for extracting the tabular structure, both of which work unsupervised, hence it does not require any manually labelled training data. The first approach is based on clustering words into columns and rows based on their horizontal or vertical overlap. The second method takes a dual perspective and analyses one dimensional projections of the words' bounding boxes and selects column and row boundaries at selected minima.
3.2.1 Clustering words inside the table region
The idea of this approach is based on the method presented in [7], which was applied to raw ASCII text. We perform hierarchical agglomerative clustering on all words in the table region in order to identify their most likely groupings into columns and rows.
To identify columns we represented each word by its 2-dimensional horizontal span vector consisting of the start and end x-coordinate. First, one cluster is generated for each word, and at each step the two closest clusters are merged into a new cluster. As a distance measure between words we use the standard Euclidean distance. If information about lines is available, we exploit it by setting the distance of those word pairs to positive infinity that are separated by a line, which ensures these words end up in different columns. As inter-cluster distance we use "average link", i.e., the distance between two clusters is the average distance of all inter-cluster pairs of words. The merging of clusters is repeated until the inter-cluster distance exceeds a predefined threshold; here, we choose 100, however, the exact value is not too critical since further processing of the clustering is required to determine the final columns.
The result of the clustering is a tree structure, where the individual words of the table are contained in the leafs and the inner nodes represent different levels of vertical groupings of those words. To arrive at the columns we have to find the correct nodes in the tree that correspond to the columns. This is done by traversing the tree in a breadth-first manner. We start by putting the root node into a queue. For each node in the queue we check whether it should be split; if yes, its children are put into a queue, otherwise the node is interpreted as a column. This is repeated until the queue is empty.
For each node we define the inter-cluster gap as the median horizontal gap between any pair of words that are contained in two different child clusters. A node is split if at least one of the following conditions hold:
- it is the root node, or
- the inter-cluster gap of the node is larger than a predefined constant (here 10), or
- the inter-cluster gap is larger than 0.5 times the running average of all the inter-cluster gaps seen so far.
The idea here is that nodes with large gaps should be split, but we allow for smaller gaps if they occur regularly. An example outcome of this procedure is shown in Figure 2. In this case the hierarchical clustering resulted in five top level clusters, indicated by the dendrogram at the top. Three of this five cluster nodes were split according to the rules above. In this case no further split was made, and the columns were correctly segmented.
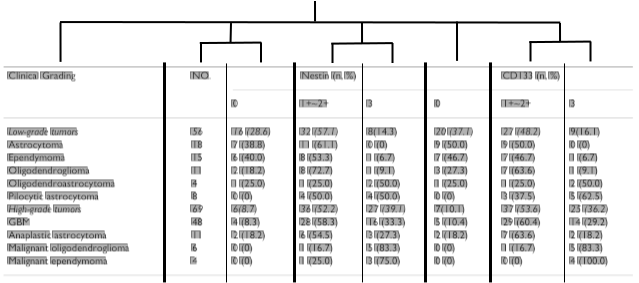
Figure 2: Example of clustering based detection of table columns. The dendrogram at the top indicates the resulting hierarchical clustering of words (rectangles) based on their vertical overlap. The vertical lines indicate the resulting column segmentation.
An analogous procedure is applied to identify rows; clustering is applied in the 2-dimensional space defined by the top and bottom y-coordinates of the words, and the resulting clusters are split vertically. The contents of the individual table cells are finally determined by a intersection operation on the respective column and row sets of words.
The main advantage of this clustering approach is that it allows for a certain amount of flexibility in the alignment of words. It handles imperfect alignment of columns as well as smaller gaps inside columns. Errors most likely occur in tables that consist of columns of varying width, e.g., if there is a very wide column that contains a lot of text. It is unlikely that in this case a single node contains the whole column; most probably the contents are split among different nodes. In this case additional operations would be required to recover the original column.
3.2.2 Partitioning based on projection histograms
The second method for extracting the tabular structure is inspired by the X-Y cut algorithm [14], a well-known document analysis method. We calculate vertical and horizontal projection histograms of the rectangular bounding boxes of all the words contained in the table region. As bin size we choose the unit in which coordinates are specified in the PDF. Boundaries of columns and rows appear as minima in these histograms, but not all minima always correspond to such boundaries. Such spurious minima could arise due to an accidental alignment of words, for example.
For columns we filter those spurious minima in three steps (for rows we simply select all minima). In order to filter all trivial minima that correspond to single spaces between words, we apply a median filter with size 5 to the histogram. From the resulting smoothed histogram we then extract all extrema by investigating non-zero differences between neighbouring histogram values: A minimum (maximum) is located at a position of a negative (positive) difference that is followed by a positive (negative) difference. Note that the resulting list of extrema always starts and ends with a maximum and alternates between minima and maxima.
Second, we remove all non-significant extrema from this list. For each extremum we calculate the difference to each of the neighbouring extrema in terms of the histogram value. If both difference values are at most 20% of the maximum histogram value we remove this extremum. In order to ensure that minima and maxima alternate we have to process the list again. Once we encounter two adjacent maxima (minima) we either remove the smaller maximum (larger minimum) or add a new minimum (maximum) at the minimal (maximal) value in between these two extrema, depending on which alternative yields a larger difference.
Third, we select those minima that finally serve as boundaries between columns. We use clustering to split both minima and maxima separately into two parts. A single iteration of the standard k-means algorithm is applied to the histogram values, resulting in an upper and lower cluster of maxima and minima, respectively. We select those minima from the lower minimum cluster that lie between two maxima of the upper maximum cluster; if there are multiple minima between a pair of maxima, we select the minimum with the smallest histogram value.
Figure 3 shows an example of a resulting column segmentation for a sample table. The histogram demonstrates the difficulty of this task. There are a lot of spurious minima due to accidental alignments within a column; additionally minima and maxima have strongly varying values. The blue lines show the correctly identified column boundaries, the red line indicates an incorrectly detected column boundary for this example.
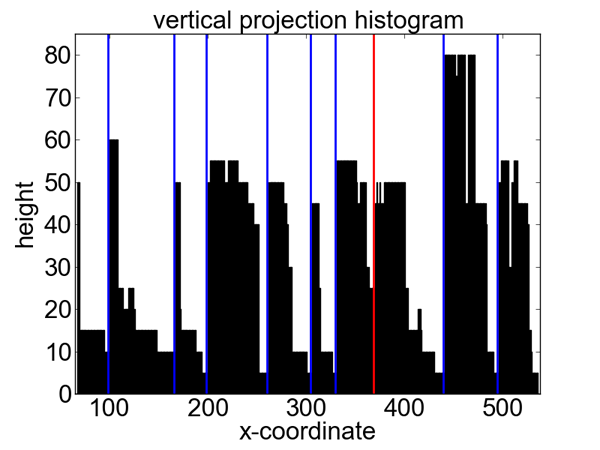
Figure 3: Example of partitioning based detection of table columns. From the sample table (top) a vertical projection histogram is computed (bottom). Shown is the raw unsmoothed histogram; vertical lines show the calculated column boundaries (blue: correct; red: incorrect).
After the detection of rows and columns we assign each word to the corresponding row and column for which the bounding box lies between the boundaries. If a word spans across a column boundary we merge the cells and set the corresponding colspan attribute. In a further post-processing step we merge additional cells if the gap between the last word of the first cell and the first word of the second cell is smaller than the average word gap plus 1.5 times the standard deviation within the table.
4. Evaluation
In this section we separately evaluate both the detection of the table region and the table structure. We used datasets from different domains and investigate different performance measures and compared the results to commercial table recognition approaches.
4.1 Datasets
We used two different datasets in our evaluation: one was presented at the Table Competition at ICDAR 2013 and contains government related documents with XML markups of the geometrical information of both the table region and structure. The other dataset consists of tables in CSV format from a number of scientific papers selected from Science Direct's Open Access content.
4.1.1 ICDAR
The Table Competition at ICDAR 2013 aimed at the comparison of current methods for table region detection and table structure recognition from born-digital PDF documents [5]. It provided a dataset consisting of 59 PDF files containing publicly available information from governmental sources (34 files from the EU government and 25 files from the US government). This offers a nice opportunity to evaluate the generalization capability of our table recognition algorithms, which were specifically designed for scientific articles, to a more general domain.
In total these 59 files contain 93 tables. Each document is accompanied by two XML files that provided the ground truth for the tables in this document. One XML file contains information about the table location in the form of a bounding box. The other XML file defines the tabular structure by specifying for each table cell its bounding box, its content, as well as its start and end coordinates in the underlying table grid (equivalent to the rowspan and colspan attributes of HTML tables). This allows for a separate evaluation of table region detection and table structure recognition.
We evaluated our algorithms on the practice dataset of the competition, which was first described in [4]. This paper also proposed a new strategy for evaluating the tabular structure, which is based on measuring the retrieval of adjacency relations of neighbouring cells. We used this performance measure in our evaluation as well.
In order to determine the quality of the table extraction, it is necessary to map each ground truth table to its corresponding extracted table. In this case we associate each ground truth table with that extracted table that has the greatest overlap with the ground truth table. This method was suggested by the organizers of the ICDAR 2013 Table Competition.
4.1.2 Science Direct
In contrast to the ICDAR dataset this dataset contains scientific documents from various domains. 50 papers were manually selected from Science Direct's Open Access content. The articles came from different domains and journals to increase the diversity of formatting styles. Each article contains one or more tables; in total there were 129 ground truth tables. The ground truth for each table is provided as one CSV file, which, in addition to the tabular structure, includes the label (e.g., "Table 2") and the description (caption). Since the original CSV files from Science Direct did not contain information about cells spanning multiple rows or columns, this information was added manually to the individual cells with a special mark-up. This step was necessary to obtain correct neighbourhood relations between cells, which is essential for the table structure evaluation.
Since most documents contain more than one table, we determined the mapping from ground truth tables to extracted tables by comparing labels and descriptions/captions. We paired each ground truth table with the extracted table that had a matching table number and the caption with the minimum Levenshtein distance to the ground truth caption. The second criterion comes into play when two tables with the same number are extracted, e.g., due to a spurious caption block. While this mapping can potentially be erroneous, there were no incorrectly associated table pairs for this particular dataset.
4.2 Table region detection
The quality of the table region detection is measured in terms of the overlap between the extracted table region and the region specified by the ground truth. Since the Science Direct dataset does not provide any geometrical information, this overlap has to be evaluated in terms of the contained objects. We followed the approach suggested in [5] and evaluated precision and recall of individual characters. In order to account for differences in the character encodings between the PDF and the ground truth we normalized the content string of each table cell by removing white-space characters and by replacing all non-alphanumeric characters with an underscore.
Table 1 shows the performance of our table region detection algorithm on both datasets. For each table we calculated the number of extracted characters ("# extracted"), the number of characters in the ground truth ("# true"), and the size of the intersection, i.e., the number of correctly extracted characters ("# correct"). Precision is then given as # correct/# extracted and recall as # correct/# true. For the "per-document average" we first calculated these performance values for each document separately and then averaged them across documents. This weighted each document equally and prevented skewing the result by few tables with a large number of cells. The "micro average" was calculated by first summing over individual character counts and calculate overall precision and recall. The total individual character counts are displayed in the table as well.
Table 1: Results of the table region detection measured as the retrieval performance of individual characters.
| Precision | Recall | |
| ICDAR 2013 Per-document average Micro average |
0.825 0.796 (12097/15198) |
0.918 0.940 (12097/12876) |
| Science Direct Per-document average Micro average |
0.842 0.823 (60003/72897) |
0.952 0.918 (60003/65368) |
It can be seen that for both datasets the precision is around 0.8 and the recall is between 0.9 and 0.95. This indicates that the extracted table regions usually contain the complete table, but there is a tendency to add additional text blocks to the table region. The table region detection performance is also influenced by errors in previous processing stages, such as the text block extraction or the block labelling stage. For example there might be blocks incorrectly labelled as sparse blocks, or text blocks spanning across the table border.
It is important to note that we only included those documents in the analysis for which a matching table was found. For the ICDAR 2013 dataset this was the case for only 14 of the 59 documents. We did not find the remaining tables because they did not have a designated table caption as it is the case for scientific documents. But the results in Table 1 demonstrate that the table region detection in principle also generalizes to this domain. Concerning the Science Direct dataset we were not able to match 4 of the 129 tables, which can be attributed to errors in the text block extraction or low-level PDF parsing.
Other well-known measures from document analysis are completeness and purity [17]. A table is complete if it includes all characters from the ground truth region; a table is pure if it does not include any items not in the ground truth region. For the ICDAR 2013 dataset there are 15 complete tables and 5 pure tables. In the Science Direct dataset there are 103 complete tables and 47 pure tables.
4.3 Table structure detection
Evaluation of the table structure detection requires assessing the quality of the extracted grid of table cells. We did this in two ways. The first method measures the retrieval of individual table cells based on their textual content. The second method was developed in [4] and used in the ICDAR 2013 Table Competition [5]. It is inspired by Hurst's proto-links [9] and measures the retrieval performance of adjacency relations between table cells. For each table a list of adjacency relations between each content cell and its nearest neighbour to the right and to the bottom is generated. No adjacency relations are generated for pairs of cells where one of them has no content. This list of adjacency relations is then compared to the ground truth by using precision and recall measures (see Figure 1 of [4] for an illustration). A pair of neighbouring cells is classified as correct, if cells with the same content are also neighbouring cells in the same direction in the ground truth.
Table 2 shows the performance of both table structure detection methods, the word clustering approach and the histogram partitioning approach, on the ICDAR 2013 dataset; Table 3 shows the same performance values for the Science Direct dataset. Both tables show micro averages.
Table 2: Results of both table structure detection methods on the ICDAR 2013 dataset (micro averages), given as the retrieval performance of individual cells and adjacency relations.
| Precision | Recall | |
| Clustering Individual cells Adjacency relations |
0.764 (6490/8500) 0.766 (10226/13349) |
0.863 (6490/7522) 0.782 (10226/13062) |
| Partitioning Individual cells Adjacency relations |
0.867 (6551/7553) 0.864 (10785/12481) |
0.871 (6551/7522) 0.826 (10785/13062) |
Table 3: Results of both table structure detection methods on the Science Direct dataset (micro averages), given as the retrieval performance of individual cells and adjacency relations.
| Precision | Recall | |
| Clustering Individual cells Adjacency relations |
0.582 (6154/10570) 0.538 (8423/15665) |
0.767 (6154/8027) 0.637 (8423/13218) |
| Partitioning Individual cells Adjacency relations |
0.791 (6465/8178) 0.723 (9724/13451) |
0.805 (6465/8027) 0.736 (9724/13218) |
The approach based on partitioning the projection histograms clearly outperforms the word clustering method. This indicates that the information contained in the spaces between words is more helpful in detecting the tabular structure than the overlap between words. In all settings the retrieval performance is strictly higher for individual cells, which is obvious since for the evaluation of the adjacency relations only those cells are marked as correct that have the correct neighbours.
Because the ICDAR 2013 dataset provided an explicit ground truth for the table region we were able to evaluate the structure of the extracted tables given the correct information about their location. Therefore the result is not influenced by errors from the table region detection stage. The Science Direct dataset on the other hand does not provide any information about the location of the table, so we only could evaluate the combined performance including the region detection. Therefore the measured performance values are substantially higher for the ICDAR 2013 dataset. The higher recall and lower precision for the Science Direct dataset might result from the table region detection, where there is also higher recall and lower precision due to the fact that it is more likely that the extracted regions are too large than too small.
Another source of error affecting these performance values is that the evaluation is based on the comparison of text. Although we remove white-spaces and special characters from all strings before the comparison, there might still problems with mathematical symbols which are not correctly extracted from the PDF. In some cases, Greek letters were extracted as Latin letters, and minus signs were not encoded as text, but as lines. This could result in very low performance values, even if the extracted structure is completely correct. For any cell where the text content does not match the ground truth content, potentially 4 adjacency relations are wrong.
The evaluation using adjacency relations has the advantage that it makes the comparison invariant to the absolute position within the table (e.g., if everything is shifted by one cell) and also avoids ambiguities arising with dealing with different types of errors (merged/split cells, inserted empty column, etc.). On the other hand this performance measure is very restrictive. Certain structural errors, such as merged columns or additional rows are punished very hard because it affects not only the cells in question, but also all neighbouring cells. Therefore, one should keep in mind that even if an extracted table has a low structure detection performance, its subjective quality might still be reasonable.
4.4 Comparison to commercial table recognition approaches
A number of commercial systems are available that support the recognition of tables in PDF documents. Four of them have been evaluated in the context of the ICDAR 2013 Table Competition [5]. There it was shown that ABBYY FineReader and OmniPage Professional achieved the best performance. In terms of table location the precision and recall of both software systems was above 0.95, thus they outperform our approach with 0.83 precision and 0.92 recall. The performance values of the other systems, Adobe Acrobat and Nitro Pro, were between 0.87 and 0.93. For all commercial systems table region detection was substantially more precise than our algorithms, which are biased towards higher recall. As far as tabular structure detection is concerned, the retrieval performance of FineReader and OmniPage was between 0.83 and 0.87, which is comparable to our results of 0.864 precision and 0.826 recall, however, the evaluation in [5] could only be performed for the complete process including table region detection. The results of Acrobat and Nitro were substantially lower (between 0.67 and 0.84).
We evaluated two more off-the-shelf systems on the Science Direct dataset, PDFlib TET and pdfx. TET is a commercial software that extracts text, images and metadata from PDF documents. It converts PDF documents to an XML-based format called TETML which also contains the extracted tables. pdfx is not a commercial, but an academic system developed at the University of Manchester [1]. It reconstructs the logical structure of scientific articles in PDF format in a rule-based manner and outputs the result in an XML document, including the tables. Both systems extract the structure of tables in the form of rows of cells, similar to an HTML table.
Table 4 shows the results for both systems for the table region detection and table structure detection. It can be seen that the TET system achieves considerably better results than pdfx. Our table region detection performance on the Science Direct data set has comparable precision and better recall. Regarding the table structure detection the TET system substantially outperforms both our clustering and partitioning approach, whereas the pdfx system is comparable to the worse performing clustering approach. However, both systems miss much more tables in the detection phase. Whereas our table region detection was not able to recover 4 of 129 tables in the Science Direct dataset, the TET system misses 61, and the pdfx system fails to retrieve 64 tables.
Table 4: Results of two table recognition systems on the Science Direct dataset (micro averages), given as the retrieval performance of characters (table region), as well as individual cells and adjacency relations (table structure).
| Precision | Recall | |
| TET Characters Individual cells Adjacency relations |
0.849 (17219/20283) 0.941 (2810/2986) 0.901 (4339/4816) |
0.780 (17219/22086) 0.826 (2810/3404) 0.783 (4339/5542) |
| pdfx Characters Individual cells Adjacency relations |
0.766 (18035/23558) 0.592 (1807/3055) 0.550 (2658/4833) |
0.807 (18035/22350) 0.596 (1807/3030) 0.536 (2658/4960) |
5. Conclusion
In this paper we have described two algorithms for recognizing tables from digital scientific articles stored as PDF. Both techniques make use of heuristics and unsupervised learning, in particular clustering, and do not require any manually labelled training data. Unsupervised techniques are especially interesting because of their flexibility to adapt to new input statistics without the need to retrain a model. This could be useful in many digital library scenarios due to the changing and dynamic nature of corpora.
Table recognition algorithms generally consist of two parts: the detection of the table region and the extraction of the tabular structure. For the latter part we presented two different approaches: one is based on clustering words inside the table region, the other one is based on partitioning one-dimensional projection histograms. We separately evaluated both parts of our algorithms and compared the two approaches on two different datasets, one consisting of scientific articles and one from a non-scientific domain. Our results show that our table recognition algorithms generalize well to other domains, even though they were specifically designed for the application to scientific articles. We also compared our results to off-the-shelf table recognition systems, TET and pdfx. Both systems were able to extract only about half of the tables that our algorithms do. The commercial TET system achieves a superior performance in structure extraction, but as the details of the algorithms are not publicly available, it is not clear whether this performance gap is due to a fundamentally different approach or just due to a large number of heuristics. The pdfx system, which is purely based on rules and heuristics, is outperformed by our techniques that are based on unsupervised machine learning.
Our performance values are implicitly affected by errors occurring in previous stages of our PDF processing, such as the extraction and labelling of contiguous text blocks. One major problem with the extraction of text content from PDF files using PDFBox and other tools is that the information provided about individual characters is inherently noisy, for example, height and width information might be wrong, or information about the font of some characters might be missing. This implicit noise affects also the performance of our algorithms, and we believe that their performance could be improved if this low-level information would be more reliable.
In future work we plan to improve our table recognition algorithms in several ways. One of the main drawbacks of the table region detection is that it relies on the presence of a table caption, which is often not present in non-scientific documents. This could be overcome by detecting directly the tabular structure, e.g., by analysing the distribution of word gaps or white-space correlations between adjacent lines. We also would like to investigate improvements to the tabular structure extraction. Currently, rows and columns are segmented in the same symmetric manner, but we believe that a special handling of the two cases would improve the extraction performance. Further ideas are to further exploit the presence of lines as indicators for row and column boundaries, and to tackle tables spanning multiple pages.
Acknowledgements
The presented work was in part developed within the CODE project (grant no. 296150) and within the EEXCESS project (grant no. 600601) funded by the EU FP7, as well as the TEAM IAPP project (grant no. 251514) within the FP7 People Programme. The Know-Center is funded within the Austrian COMET Program — Competence Centers for Excellent Technologies — under the auspices of the Austrian Federal Ministry of Transport, Innovation and Technology, the Austrian FederalMinistry of Economy, Family and Youth and by the State of Styria. COMET is managed by the Austrian Research Promotion Agency FFG.
References
[1] A. Constantin, S. Pettifer, and A. Voronkov. PDFX: Fully-automated PDF-to-XML Conversion of Scientific Literature. In Proceedings of the 13th ACM symposium on Document Engineering, 2013. http://doi.org/10.1145/2494266.2494271
[2] J. Fang, L. Gao, K. Bai, R. Qiu, X. Tao, and Z. Tang. A Table Detection Method for Multipage PDF Documents via Visual Seperators and Tabular Structures. 2011 International Conference on Document Analysis and Recognition, pages 779—783, Sept. 2011. http://doi.org/10.1109/ICDAR.2011.304
[3] L. Gao, Z. Tang, X. Lin, Y. Liu, R. Qiu, and Y. Wang. Structure extraction from PDF-based book documents. In Proceedings of the 11th annual international ACM/IEEE joint conference on Digital libraries, pages 11—20, 2011. http://doi.org/10.1145/1998076.1998079
[4] M. Göbel, T. Hassan, E. Oro, and G. Orsi. A methodology for evaluating algorithms for table understanding in PDF documents. Proceedings of the 2012 ACM symposium on Document engineering — DocEng '12, page 45, 2012. http://doi.org/10.1145/2361354.2361365
[5] M. Göbel, T. Hassan, E. Oro, and G. Orsi. ICDAR 2013 Table Competition. 2013 12th International Conference on Document Analysis and Recognition, pages 1449—1453, Aug. 2013. http://doi.org/10.1109/ICDAR.2013.292
[6] T. Hassan and R. Baumgartner. Table Recognition and Understanding from PDF Files. Ninth International Conference on Document Analysis and Recognition (ICDAR 2007) Vol 2, pages 1143—1147, Sept. 2007. http://doi.org/10.1109/ICDAR.2007.4377094
[7] J. Hu, R. Kashi, D. Lopresti, and G. Wilfong. Table structure recognition and its evaluation. Proc SPIE Vol 4307 p 4455 Document Recognition and Retrieval VIII Paul B Kantor Daniel P Lopresti Jiangying Zhou Eds, 4307:44—55, 2000. http://doi.org/10.1016/j.patcog.2004.01.012
[8] J. Hu, R. Kashi, D. Lopresti, and G. Wilfong. Evaluating the performance of table processing algorithms. International Journal on Document Analysis and Recognition, 4(3):140—153, 2002. http://doi.org/10.1007/s100320200074
[9] M. Hurst. A constraint-based approach to table structure derivation. Seventh International Conference on Document Analysis and Recognition, 2003. Proceedings, 1(Icdar):911—915, 2003. http://doi.org/10.1109/ICDAR.2003.1227792
[10] T. G. Kieninger. Table structure recognition based on robust block segmentation. Proceedings of SPIE, 3305:22—32, 1998. http://doi.org/10.1117/12.304642
[11] S. Klampfl and R. Kern. An Unsupervised Machine Learning Approach to Body Text and Table of Contents Extraction from Digital Scientific Articles. In Research and Advanced Technology for Digital Libraries, pages 144—155, 2013. http://doi.org/10.1007/978-3-642-40501-3_15
[12] Y. Liu, P. Mitra, and C. L. Giles. Identifying table boundaries in digital documents via sparse line detection. In Proceeding of the 17th ACM conference on Information and knowledge mining CIKM 08, pages 1311—1320. ACM Press, 2008. http://doi.org/10.1145/1458082.1458255
[13] D. Lopresti and G. Nagy. A tabular survey of automated table processing. In International Workshop on Graphics Recognition, volume 1941, page 93. Springer, 2000. http://doi.org/10.1007/3-540-40953-X_9
[14] G. Nagy and S. Seth. Hierarchical representation of optically scanned documents. In Proceedings of International Conference on Pattern Recognition, volume 1, pages 347—349, 1984.
[15] A. Nurminen. Algorithmic extraction of data in tables in PDF documents. PhD thesis, 2013.
[16] E. Oro and M. Ruffolo. PDF-TREX: An Approach for Recognizing and Extracting Tables from PDF Documents. 2009 10th International Conference on Document Analysis and Recognition, pages 906—910, 2009. http://doi.org/10.1109/ICDAR.2009.12
[17] A. C. e. Silva. Metrics for evaluating performance in document analysis — application to tables. International Journal on Document Analysis and Recognition (IJDAR), 14(1):101—109, 2011. http://doi.org/10.1007/s10032-010-0144-2
[18] X. Wang. Tabular Abstraction, Editing and Formatting. PhD thesis, 1996.
[19] B. Yildiz, K. Kaiser, and S. Miksch. pdf2table: A Method to Extract Table Information from PDF Files. In IICAI, pages 1773—1785, 2005.
[20] R. Zanibbi, D. Blostein, and J. R. Cordy. A survey of table recognition. Document Analysis and Recognition, 7(1):1—16, 2004. http://doi.org/10.1007/s10032-004-0120-9
[21] K. Zuyev. Table image segmentation. In Proceedings of the Fourth International Conference on Document Analysis and Recognition, volume 2, pages 705—708. IEEE Comput. Soc, 1997. http://doi.org/10.1109/ICDAR.1997.620599
About the Authors
 |
Stefan Klampfl is a postdoctoral researcher at the Know-Center, with expertise in the fields of machine learning and data analysis. He received both his DI degree (in Telematics; equivalent to an MSc in information and communication technology) and his PhD (in computational neuroscience) at Graz University of Technology. In his PhD thesis he investigated unsupervised machine learning algorithms and their role in information processing in the brain, and analyzed biological data using methods from machine learning and information theory. He contributed to a number of high-impact conference and journal publications. |
 |
Kris Jack is the Chief Data Scientist at Mendeley and is responsible for the development of their data science technologies. He has over ten years of experience in both academia (PhD in AI, University of Dundee; Research Associate, NaCTeM, UK) and industry (Expert R&D Engineer in Orange Labs and the CEA) of solving complex large scale data problems. |
 |
Roman Kern is the division manager of the Knowledge Discovery area at the Know-Center and senior researcher at the Graz University of Technology, where he works on information retrieval and natural language processing. In addition he has a strong background in machine learning. Previous to working in research he gained experience in industry projects at Hyperwave and Daimler. There he worked as project manager, software architect and software engineer for a number of years. He obtained his Master's degree (DI) in Telematics and his PhD in Informatics at the Technical University of Graz. After his studies he worked at a start-up company in the UK as a Marie Curie research fellow. He participates in a number of EU research projects, where he serves as coordinator and work package leader. He manages a number of large research and development projects in cooperation with the industry. He also gives lectures at the Technical University of Graz for Software Architecture, Knowledge Discovery and Data Science. He also serves as supervisor for Bachelor, Master and PhD students. He published over 40 peer-reviewed publications and achieved top rank results in international scientific challenges like CLEF, ACL SemEval. Most of his publication work can be accessed online. |
|
|
|
| P R I N T E R - F R I E N D L Y F O R M A T | Return to Article |